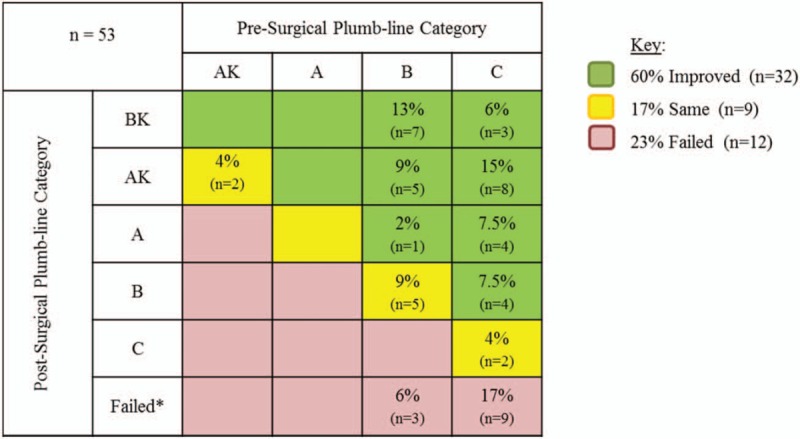
Figure 6.

Grid depicting the % and number of cases that improved, remained the same, and failed by pre- to post-surgical clinical plumb-line category. Each box in the grid represents the change in the clinical plumb-line assessment pre- to post-surgery. For example, 13% of all cases (n = 7) went from a “B” pre-surgery plumb-line category to a “BK” post-surgery plumb-line category, which represented an improvement. The improvement in post-surgical grade via McNemar test was significant (P < .01). n = sample size, ∗ = failed PFN surgeries were defined as requiring subsequent surgery or transitioning into a more varus clinical alignment. PFN = planned fibular nonunion.
