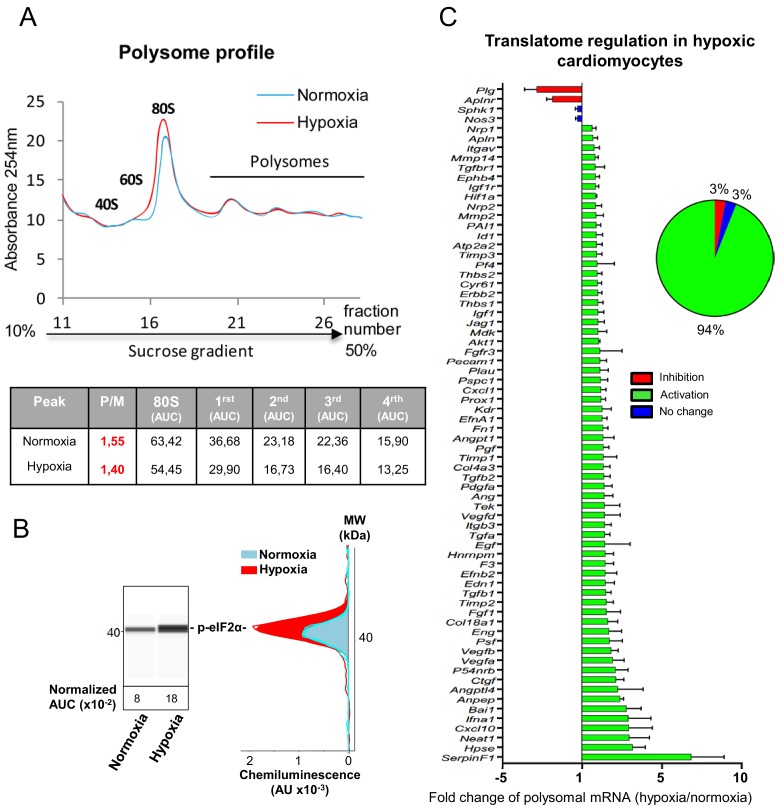
Figure 2. mRNAs of most (lymph)angiogenic genes are mobilized into polysomes in hypoxic cardiomyocytes.
(A-C) In order to isolate translated mRNAs, polysomes from HL-1 cardiomyocytes in normoxia or after 4 hr of hypoxia at 1% O2 were purified on a sucrose gradient, as described in 'Materials and methods'. Analysis was performed using a fluidigm PCR array from three biological replicates (cell culture well and cDNA), each of them measured in three technical replicates (PCR reactions). P/M ratio (polysome/monosome) was determined by delimiting the 80S and polysome peaks by taking the lowest plateau values between each peak and by calculating the area under the curve (AUC). Then the sum of area values of the four polysome peaks was divided by the area of the 80S peak (A). Translation blockade was measured by eIF2α phosphorylation quantification by Jess capillary Simple Western, normalized to the Jess quantification of total proteins (as described in 'Materials and methods'). Three independent experiments were done; a representative experiment is shown (B). RNA was purified from polysome fractions and from cell lysate before loading. cDNA and PCR arrays were performed as in Figure 1. Polysomes profiles are presented for normoxic and hypoxic cardiomyocytes. Relative quantification (RQ) of gene expression during hypoxia was calculated using the 2–ΔΔCT method with normalization to 18S rRNA and to normoxia. mRNA levels (polysomal RNA/total RNA) are shown as fold change of repression (red) or induction (green) in hypoxia normalized to normoxia as in Figure 1C. The threshold for induction was set at 1.5. When the RQ value is inferior to 1, the fold change is expressed as −1/RQ. The detailed values are available in Supplementary file 2.


