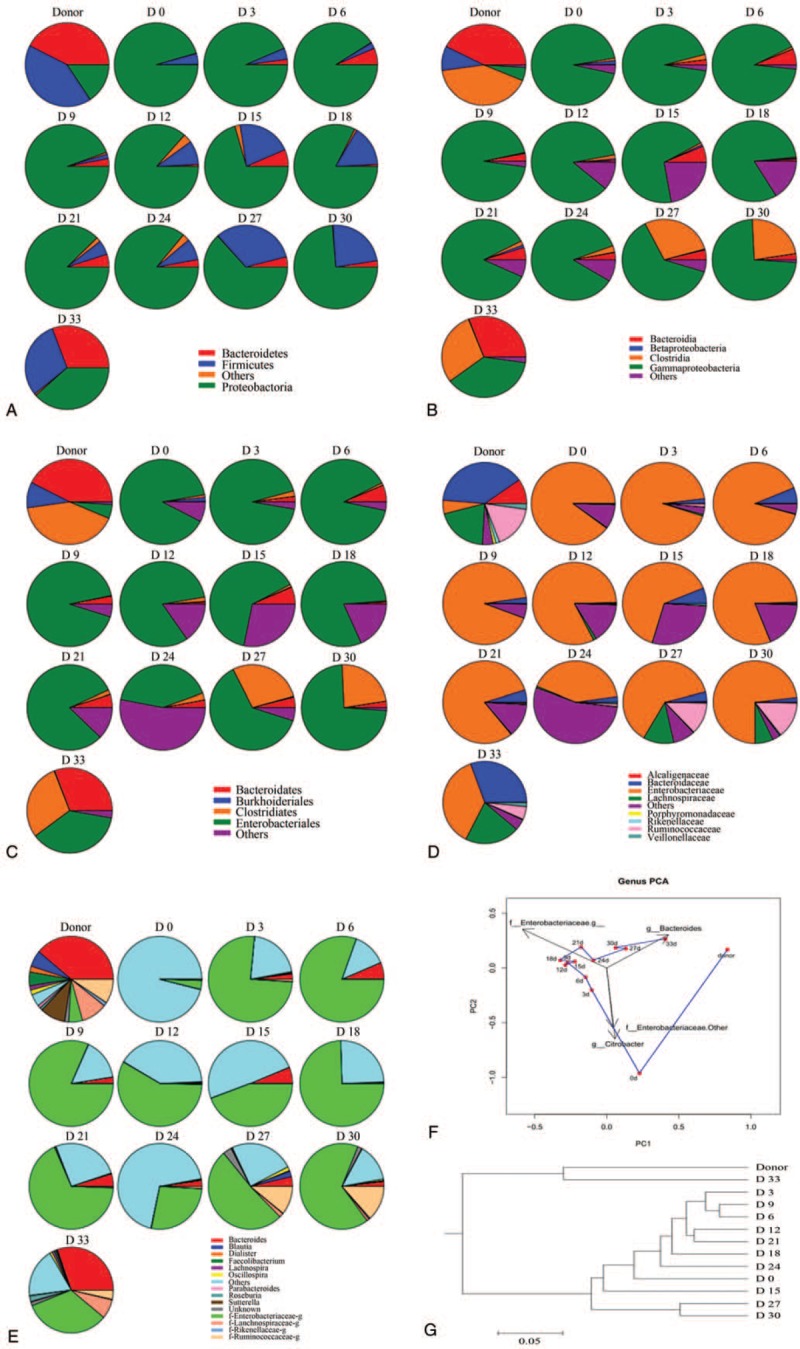
Figure 4.

Analysis of intestinal flora of the patient. (A-E) Differences in bacterial composition between fecal samples. Colors represent bacterial composition in fecal samples. (A) phyla; (B) classes; (C) orders; (D) families, or (E) genera in the patient's fecal samples. (F) Principal component analysis of bacteria based on the relative abundance of bacterial genera. (G) Clustering tree of the patient. Levels of beneficial bacteria including, Bifidobacterium, Lactobacillus, and Clostridium were found to be significantly decreased. After the patient underwent fecal microbiota transplantation, levels of these bacteria increased gradually, returning to levels similar to those of the donor.
