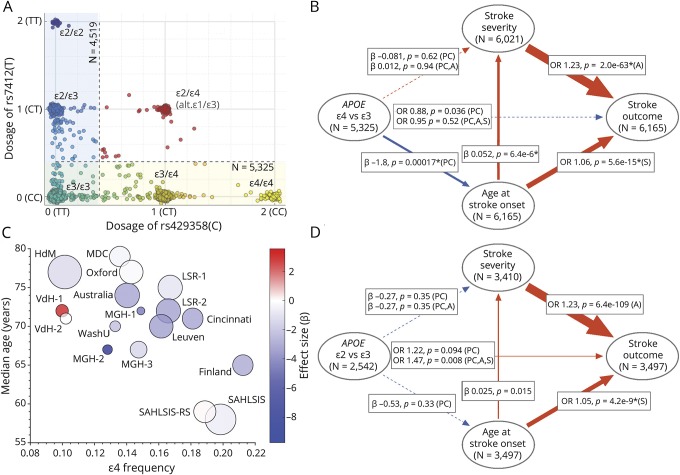
Figure. APOE allele distribution and associations with age at ischemic stroke onset, stroke severity, and outcome.
(A) Distribution of APOE alleles according to the SNPs rs429358 and rs7412. As the allele counts are inferred from imputation, they are given as a continuum between homozygosity for the major allele and homozygosity for the minor allele, with slightly shifted positions to improve clarity in the graph. In the analyses of ε4 vs ε3, 5,325 cases were included, and 4,519 cases were included in the analyses of ε2 vs ε3. Red positions correspond to cases excluded from both analyses. (B and D) Directed acyclic graphs (DAGs) displaying associations between APOE allele count and age at ischemic stroke onset, stroke severity (baseline NIH Stroke Scale score), and dichotomized 3-month mRS score (mRS score 0–2 vs 3–6). N indicates number of cases with nonmissing information, except for APOE allele count where N refers to maximum number of cases included in the analysis, that is, cases with allele dosage ≤0.4 for rs7412(T) for ε4 vs ε3 and ≤0.4 for rs429358(C) for ε2 vs ε3. Figure, B examines associations with ε4 allele count and includes both sexes, whereas figure, D displays associations with ε2 allele count in men only. Associations are reported in the squared text boxes as β and p value derived from linear regression for associations with age and stroke severity, and OR and p value derived from logistic regression for associations with poor outcome (mRS score > 2). Adjustments are indicated in the parentheses as follows: PC, adjusted for ancestry (the 5 first principal components); A, age adjusted; S, stroke severity (baseline NIH Stroke Scale) adjusted. *Refers to result from random effects meta-analysis. Arrow thickness illustrates standardized effect size after the full adjustment specified in the respective text box. Arrow color refers to the direction of the effect. A dotted arrow indicates a nonsignificant association. (C) Bubble chart showing median age at ischemic stroke onset and ε4 allele frequency for individual cohorts in GISCOME. The cohorts are described in Söderholm et al.6 Bubble diameter is proportional to the number of cases. Bubble color refers to the effect size (β) of ε4 on age at stroke onset derived from linear regression. GISCOME = Genetics of Ischemic Stroke Functional Outcome; mRS = modified Rankin Scale; OR = odds ratio; SNP = single nucleotide polymorphism.

