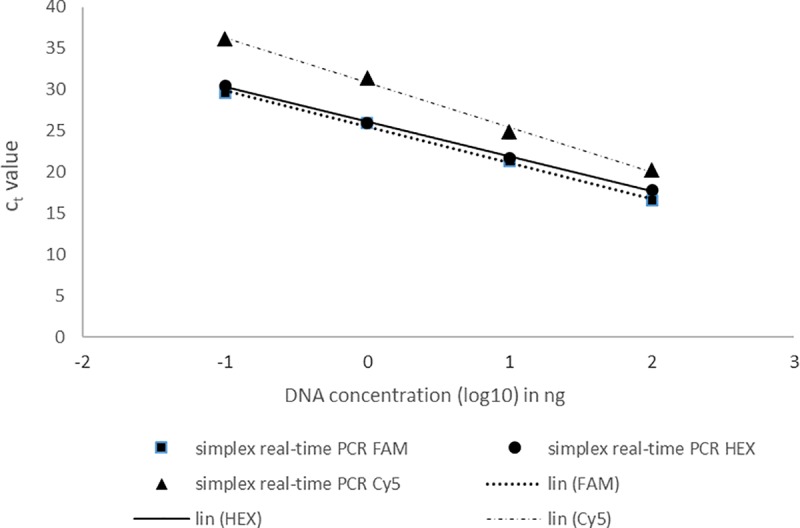
Fig 2. Detection of pathogenic Cmm, Pst and Xe in mixed samples by simplex real-time PCR assays.

Log10 values of the starting mixed DNA concentrations are plotted against the corresponding Ct values. Each dot represents data from triplicate TaqMan real-time PCR amplifications.
