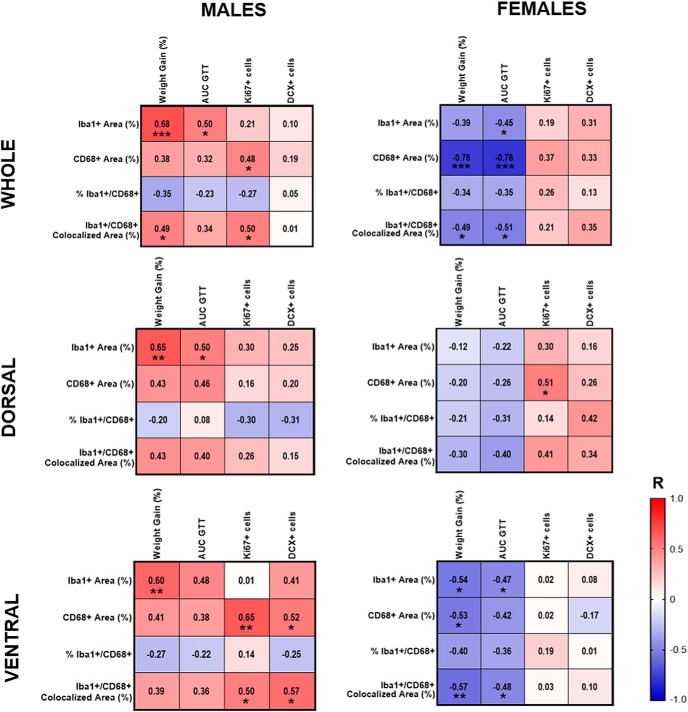
Figure 7.
Correlations of microglia measures in the inner dentate with metabolic outcomes and neurogenesis in the whole hippocampus, and in dorsal and ventral subregions of male (left) and female (right) mice. Red indicates positive correlations, and blue indicates negative correlations, with intensity of the color indicative of the strength of the association. *p < 0.05, **p < 0.01.

