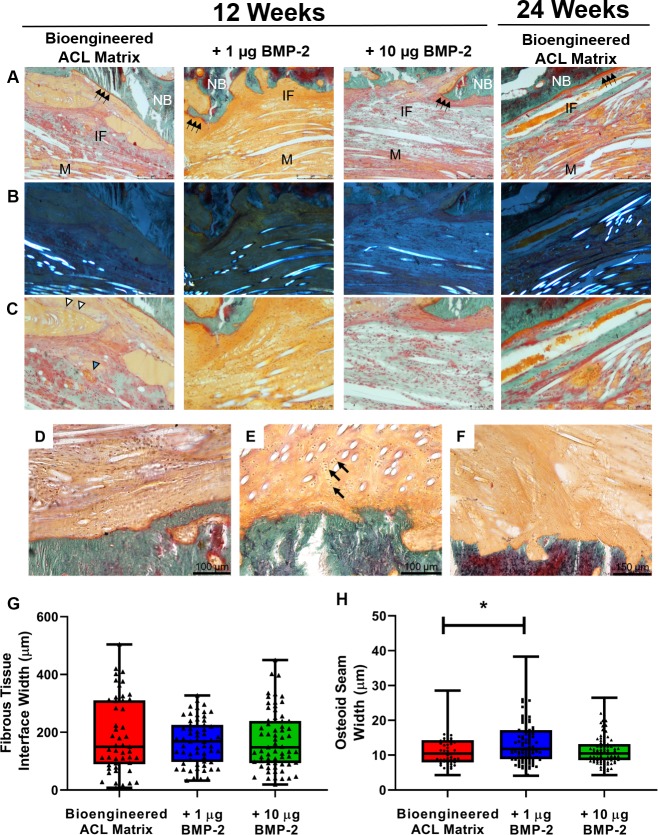
Fig 5. Goldner’s Trichrome stain of the femoral tunnel matrix-to-bone interface and quantification of the interface and osteoid seam width.
A) 80x images in the mid-center of the bone tunnel region. The osteoid seam can be seen at the matrix-to-bone interface (green arrows). The turquoise green stain in the matrix-to-bone interface demonstrates newly forming bone. At 24-weeks, greater osteointegration was observed for the bioengineered ACL matrix demonstrated by an increase in mineralized bone at the interface. B) Polarized images of the same region in panel A. The bright fiber or circular structures denote the presence of the PLLA fibers. C) Magnified images of panel A demonstrates the presence of blood vessels (blue arrowhead) and sinusoids (white arrowheads). Different modes of osteointegration seen in bone tunnel (D-F). D) Tissue is found to be parallel to PLLA fibers. E) Fibrocartilage formation with presence of isogenic groups of chondrocytes (black arrows). F) Presence of Sharpey’s fibers. Quantification of the fibrous tissue interface G) and H) osteoid seam width. The mean fibrous tissue interface width for the bioengineered ACL matrix, +1 μg BMP-2 and +10 μg BMP-2 groups are 188.7 ± 129.6 μm, 165.8 ± 78.35 μm, and 172.9 ± 102.2 μm, respectively. The mean osteoid seam width for the bioengineered ACL matrix, +1 μg BMP-2 and +10 μg BMP-2 groups are 11.66 ± 5.203 μm, 13.68 ± 6.24 μm, and 11.51 ± 4.43 μm, respectively. (* = p-value of 0.0406) NB, native bone; IF, interface; M, matrix.

