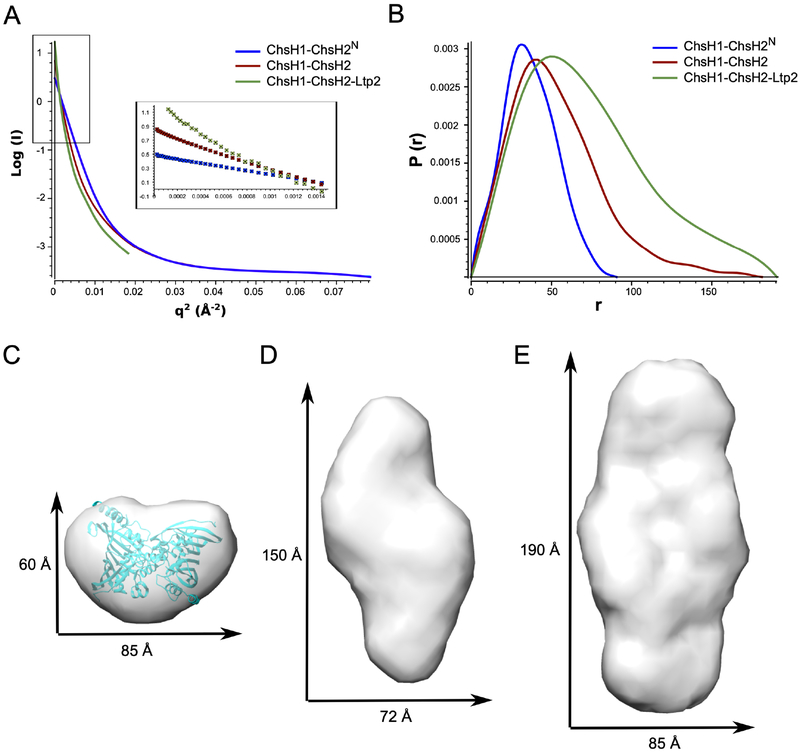
Figure 2. SAXS analysis for ChsH1-ChsH2N, ChsH1-ChsH2, and ChsH1-ChsH2-Ltp2.
(A) Guinier analysis of data showed the proteins are not aggregated. The regions used for Guinier analysis are shown as an inset. (B) Distance distribution plots from the scattering data calculated with GNOM. (C) (D) (E) Molecular envelopes generated from bead models calculated with the solution scattering data for (C) ChsH1-ChsH2N, (D) full length ChsH1-ChsH2, and (E) ChsH1-ChsH2-Ltp2 complex. In (C), the crystal structure of ChsH1-ChsH2N (PDB code: 4W78) was fitted into its SAXS envelope for comparison. The X and Y dimensions are calculated from the distance of the two most separated beads in the X and Y directions, respectively.

