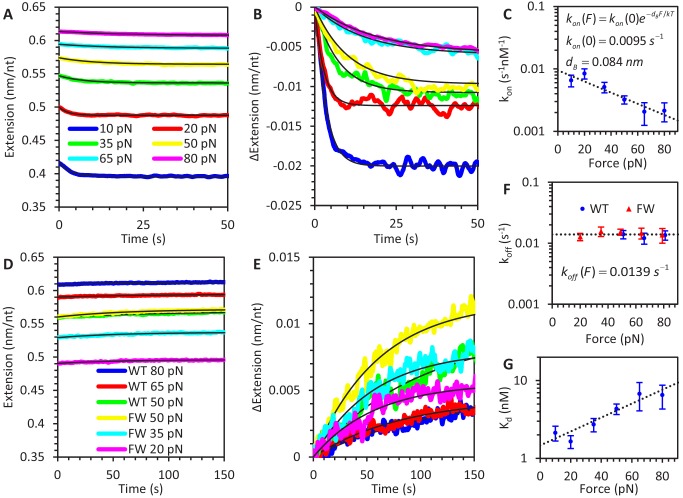
Figure 2. Force-dependent kinetics of A3G binding.
(A) ssDNA is held at a constant force ranging from 10 to 80 pN and incubated with WT A3G, resulting in a slight reduction in extended length. The initial extension is that of bare ssDNA, as predicted by the FJC model. (B) The same incubation curves are plotted as a net change in extension due to A3G binding, showing that both the rate of binding and equilibrium change in extension decrease as greater forces are applied. (C) Calculated concentration-independent binding rates as a function of force. The rates are fit to an exponential function (dotted line) in which A3G binding is inhibited by increasing force due to a characteristic contraction event dB upon initial binding. (D) A3G dissociates from ssDNA held at a constant force in the absence of free protein. WT A3G does not dissociate from ssDNA at low forces, but partially dissociates at high forces (F ≥ 50 pN, blue, red, and green lines). Oligomerization-deficient mutant A3G (FW) dissociates over all observed forces (yellow, cyan, and magenta lines). (E) The same incubation curves are plotted as a net change in extension due to A3G dissociation, showing the rate of dissociation is constant with respect to force. (F) Calculated dissociation rates of WT A3G (blue circles) and FW mutant A3G (red triangles), fit by a constant, force-independent value (dotted line. (G) Effective equilibrium dissociation constant as a function of force, calculated by dividing the constant koff value by a force dependent value for kon. Error bars are standard error based on multiple experimental replications (N ≥ 5 for kon and N ≥ 3 for koff) with different ssDNA molecules.
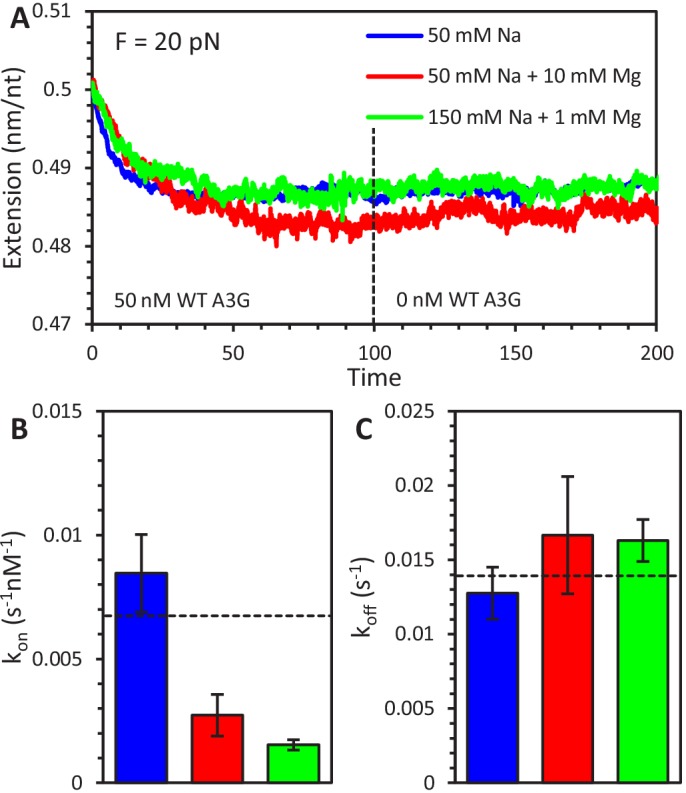
Figure 2—figure supplement 1. Effect of salt concentration on A3G binding and oligomerization.


