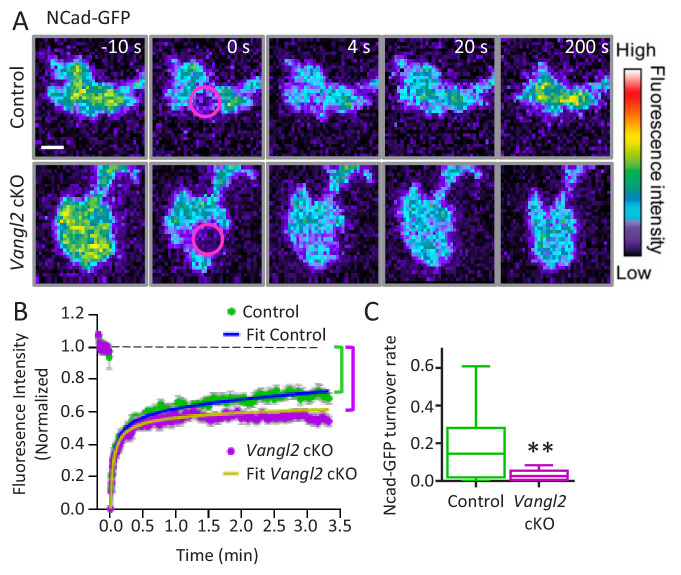
Figure 5. Vangl2 controls Ncad-GFP turnover in growth cones.
(A) Representative images of the recovery of Ncad-GFP after photobleaching, recorded by TIRF illumination in growth cones from controls (upper panels) and Vangl2 cKO (lower panels) neurons plated on Ncad-Fc substrates. Growth cones were photobleached in the selected area (circle, time 0 s) and the fluorescence recovery was recorded for the following 200 s (color coding). Scale bar, 5 µm. (B) Mean FRAP curves of the Ncad-GFP signal over time, containing individual data points ± SEM for each experiment. In the absence of Vangl2, the initial recovery (20 s) is similar to that of the control, but the long-term recovery is significantly lower. Solid lines represent a fitted diffusion-reaction model. (C) Quantification of the turnover rate of Ncad-GFP molecules involved in homophilic bonds at the membrane shows that protein turnover is significantly reduced (83%) in Vangl2 cKO growth cones compared to controls. n = 13–14 neurons, three experiments. Data are presented as box-and-whisker plots (min/max) based on three independent experiments; **p<0.01 by Student’s t-test (C).


