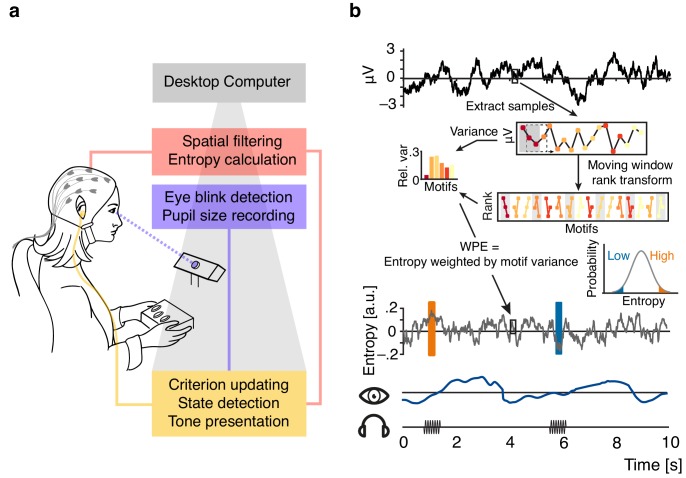
Figure 1. Illustration of the real-time closed-loop setup to track states of desynchronization.
(a) Setup: EEG signal was spatially filtered before entropy calculation. Pupil size was recorded and monitored consistently. Pure tone stimuli were presented via in-ear headphones during states of high or low entropy of the incoming EEG signal. (b) Schematic representation of the real-time algorithm: spatially filtered EEG signal (one virtual channel) was loaded before entropy was calculated using a moving window approach (illustrated for 18 samples in the upper box; 200 samples were used in the real-time algorithm). Voltage values were transformed into rank sequences (‘motifs’) separated by one sample (lower box; Equation 1 in Materials and methods; different colours denote different motifs), and motif occurrence frequencies were weighted by the variance of the original EEG data constituting each occurrence (Equations 3 and 4). Each entropy value was calculated based on the resulting conditional probabilities of 200 samples, before the window was moved 10 samples forward (i.e., effectively down-sampling to 100 Hz). Inset: The resulting entropy time-course was used to build a continuously updated distribution (forgetting window = 30 s). Ten consecutive entropy samples higher than 90% (or lower than 10%) of the currently considered distribution of samples defined states of relatively high and low desynchronization, respectively. Additionally, pupil size was sampled continuously.

