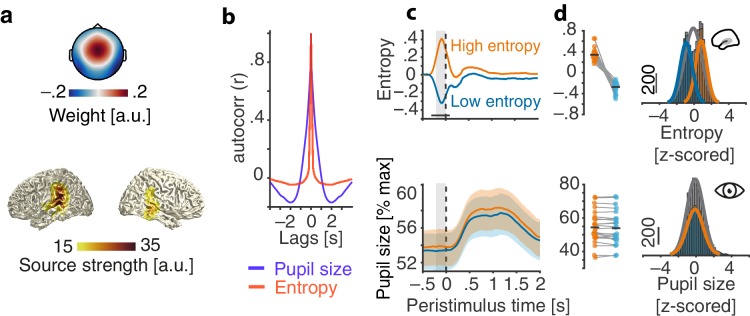
Figure 2. Evaluation of the real-time closed-loop setup for states of local desynchronization and arousal.
(a) Grand average spatial filter weights based on data from an auditory localizer task (top) and grand average source projection of the same data (masked at 70% of maximum; bottom). (b) Autocorrelation functions for EEG entropy (red) and pupil size time courses (blue). Entropy states are most self-similar at ~500 ms (~2 Hz) and pupil states at ~2 s (~0.5 Hz). (c) Grand average time-courses of entropy (upper panel) and pupil diameter (lower panel) for low-entropy (blue) and high-entropy states (orange) ± standard error of the mean (SEM). Subject-wise averages in the pre-stimulus time-window (−200–0 ms, grey boxes) in right panels. Entropy was logit transformed and baseline corrected to the average of the preceding 3 s for illustration. Pupil size was expressed as percentage of each participant’s maximum pupil diameter across all pre-stimulus time-windows. (d) Histograms and fitted distributions of absolute z-scored pre-stimulus entropy (top) and z-scored pupil size (bottom) for low-entropy states (blue), high-entropy states (orange), and both states combined (grey). Note the independence of entropy states and pupil states.


