Figure 4. Influence of pre-stimulus entropy and pupil size on tone-related activity.
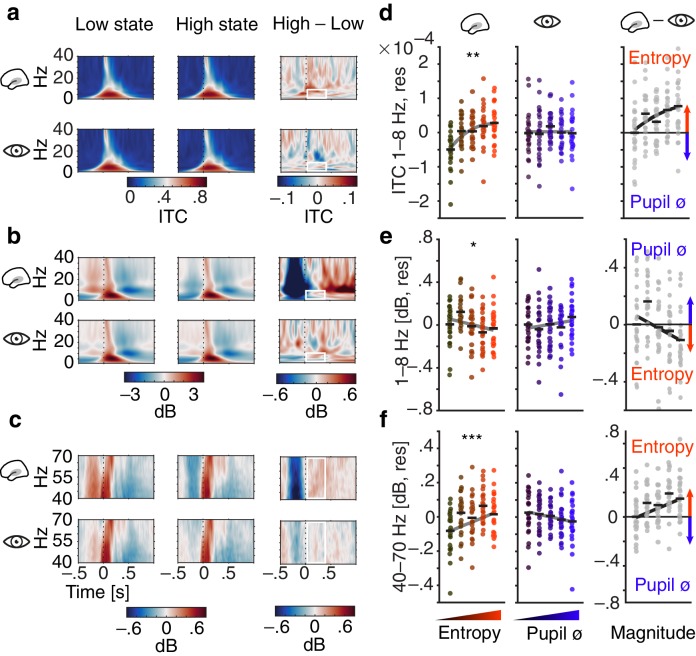
(a) Grand average ITC (0–40 Hz) across time for low states (left), high states (middle) and the difference of both (right). Entropy states shown in the upper, pupil states in the lower panel. Dashed black lines indicate tone onset, white rectangles the post-stimulus window of interest. (b) As in (a) but for low-frequency power (0–40 Hz, baselined the average of the whole trial). (c) As in (b) but for gamma power (40–70 Hz). (d) Mean centred single subject (dots) and grand average ITC (black lines), residualized for baseline entropy and pupil size, in the post-stimulus time-window (0–.4 s, 1–8 Hz) for five bins of increasing pre-stimulus entropy (left) and pupil size (residualized for entropy baseline and pre-stimulus entropy, middle). Grey line represents average fit, red colours increasing entropy, blue colours increasing pupil size. Effects of entropy and pupil size are contrasted in the right panel. (e) As in (d) but for post-stimulus low-frequency power (0–.4 s, 1–8 Hz). (f) As in (e) but for post-stimulus gamma power (0–.4 s, 40–70 Hz). Again, all binning for illustrational purposes only. ***p<0.0001, **p<0.001, *p<0.05.
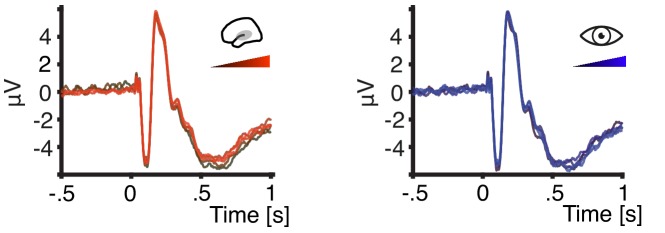
Figure 4—figure supplement 1. Grand average ERPs for increasing pre-stimulus entropy and pupil size.
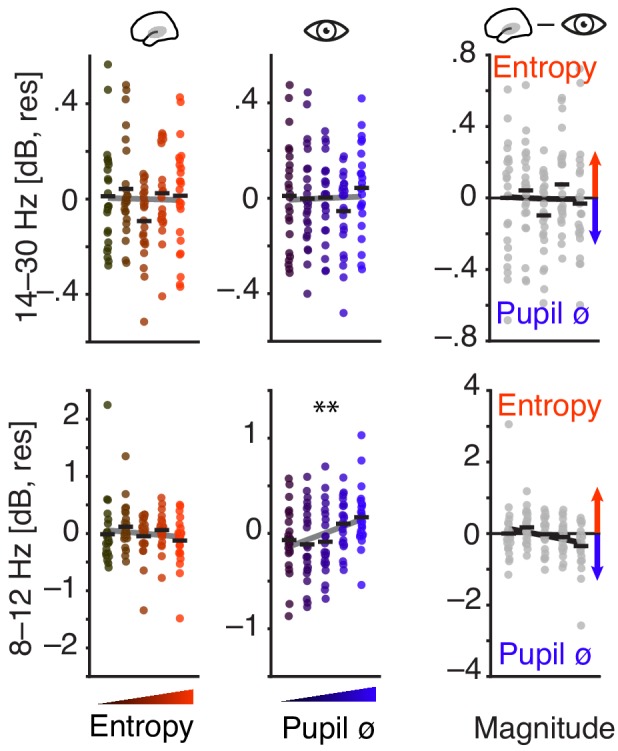
Figure 4—figure supplement 2. Tone-related activity in the alpha and beta band as a function of pre-stimulus EEG entropy and pupil size.


