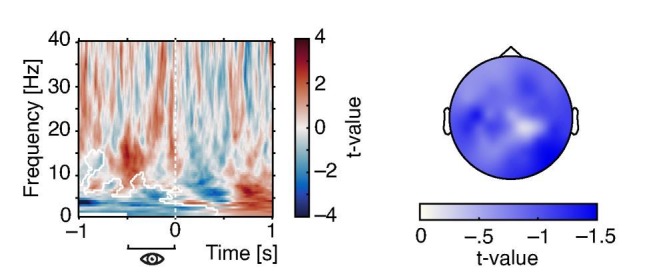
Author response image 1. Effects of pre-stimulus pupil size on oscillatory power.

Time-frequency resolved t-values from a cluster test on regression coefficients expressing the relationship between pre-stimulus pupil size (averaged between –.5 and 0 s) oscillatory power (left). Note the negative cluster covering low frequencies (white outlines). T-values averaged over time and frequency points within the significant cluster display a wide-spread topography that peaks over occipito-parietal regions (right).
