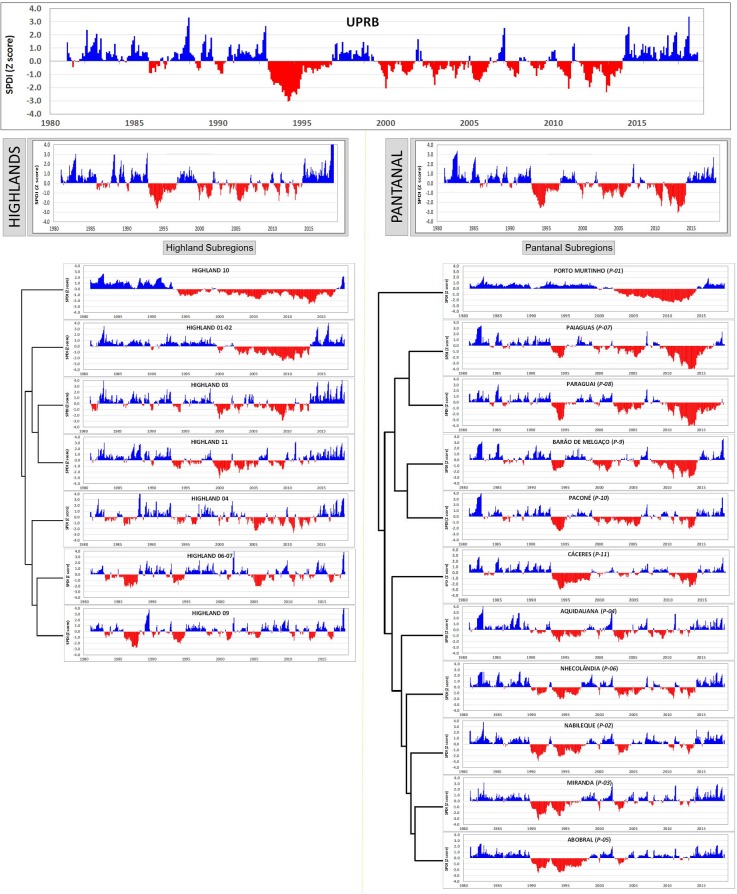
Fig 5. Temporal dynamics in the Standardized Pluviometric Drought Index (SPDI) for the Upper Paraguay River Basin (UPRB).
Here, sub-regions are clustered using correlation distance and complete linkage estimated using the statistical tool ClustVis [44]. For each graph, precipitation conditions estimated as SPDI were interpreted using the classification system from Table 1: where ≤ -2.0 is extremely dry, -1.99 to -1.5 is very dry, -1.49 to -1.0 is moderately dry, -0.99 to 0.99 near normal, 1.0 to 1.49 is moderately wet, 1.5 to 1.99 is very wet, and > 2.0 is extremely wet.

