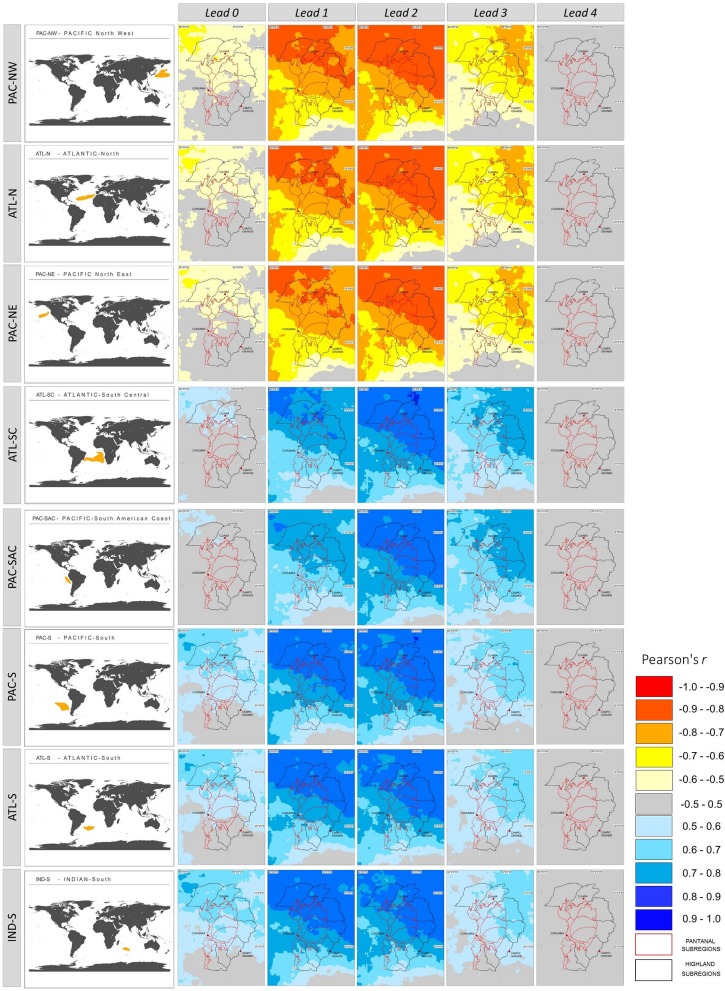
Fig 8. Spatial correlation (Pearson) between monthly mean precipitation for the Upper Paraguay River Basin (UPRB) and Sea Surface Temperature (SST) for different oceanic regions.
Lead times are given in months (top) and oceanic regions are listed at left. Fig 7 shows location of oceanic regions.

