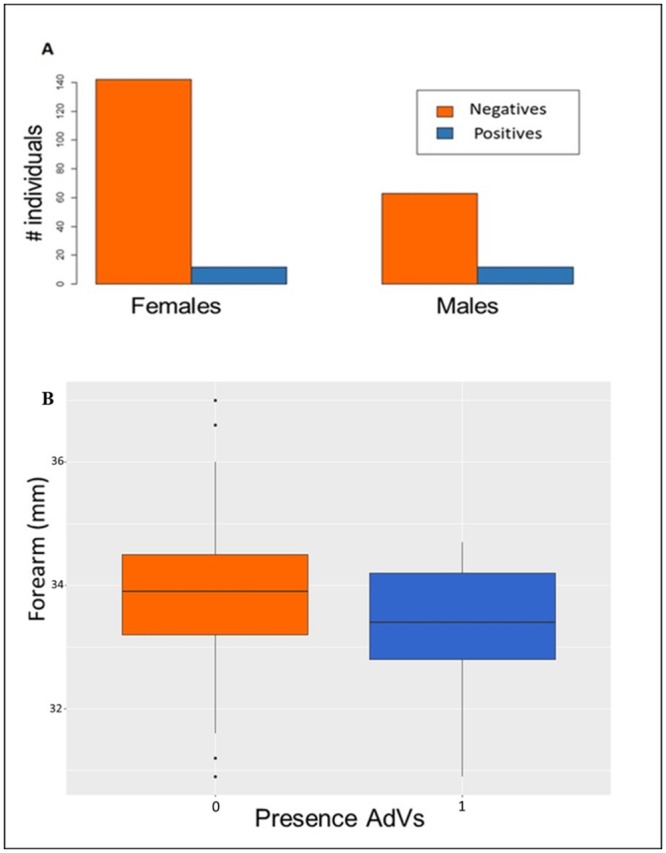
Fig 4. Results of within-species analysis.

(A) Barplot by sex of number of Nyctalus lasiopterus individuals positive (blue) and negative (orange) to adenovirus. (B) Boxplot for individuals screening negative for AdVs (0) and positive for AdVs (1) in relation to forearm length for Pipistrellus kuhlii. Black lines indicate the median value. Lower and upper hinges correspond to the first and third quartiles. The upper whisker extends from the hinge to the largest value no further than 1.5 * IQR from the hinge (where IQR is the inter-quartile range). The lower whisker extends from the hinge to the smallest value at most 1.5 * IQR of the hinge. Dots beyond the end of the whiskers indicate outlying points.
