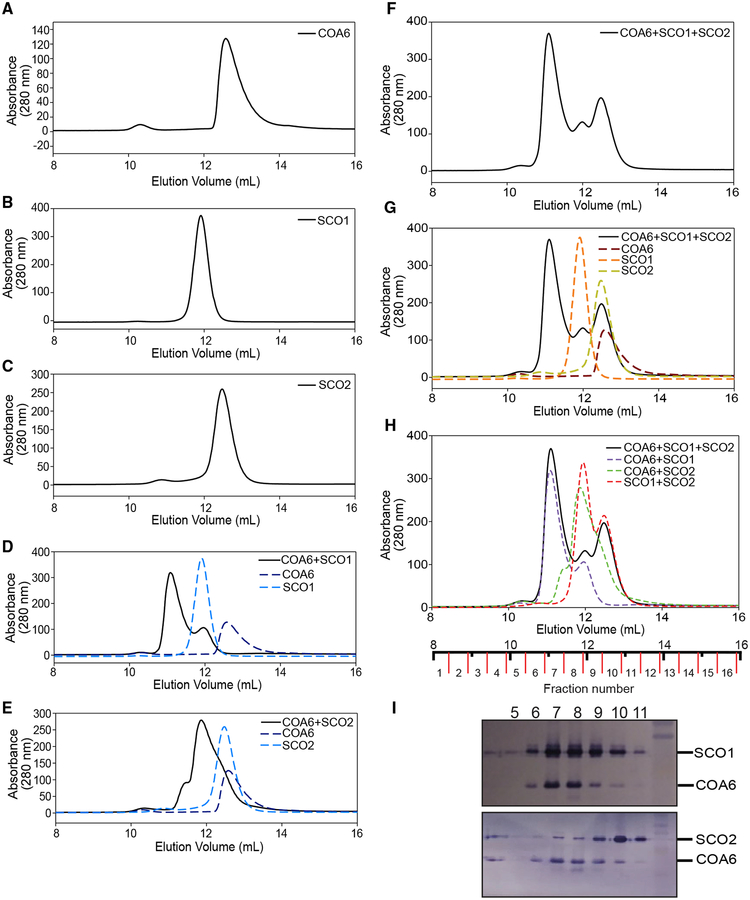
Figure 3. Human COA6 Exhibits a Stronger Interaction with SCO1 than SCO2.
(A–C) Size exclusion chromatography elution profiles of (A) COA6, (B) SCO1, and (C) SCO2.
(D–H) Elution profiles of the indicated mixtures of proteins (solid lines), compared to simulations of the indicated individual proteins or mixtures of two or more proteins (dotted lines).
(I) SDS-PAGE/western blot analysis of different fractions from size exclusion chromatogram shown as the solid black line in (F)–(H).

