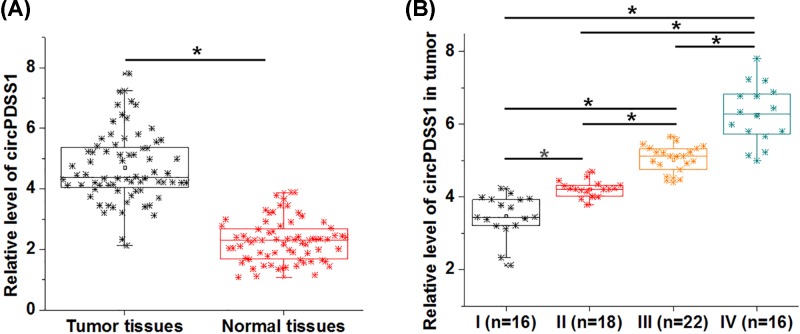
Figure 1. circPDSS1 was up-regulated in UBC tissues and affected by clinical stages.
RT-qPCR was performed to measure the levels of circPDSS1 expression in both cancer tissues and adjacent healthy tissues (A). PCRs were performed in triplicate manner and mean values were presented and compared by paired t test. Differences in expression levels of circPDSS1 in tumor tissues among patients with different clinical stages were analyzed by ANOVA (one-way) combined with Tukey’s test (*, P<0.05).

