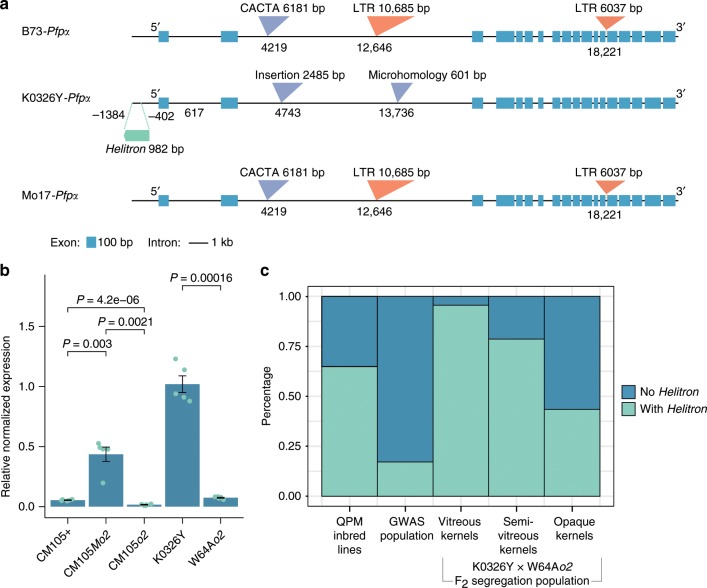
Fig. 4. Pfpα associated with o2 endosperm modification.
a Structural variation of Pfpα among K0326Y, Mo17, and B73. The gene structure of Pfpα is shown with exons in blue boxes and introns with a black line. The Helitron in the promoter is labelled as a green bar. The LTR retrotransposon insertions, abbreviated with LTR, are illustrated by orange inverted triangles. Other insertions are represented by purple inverted triangles. The physical location is based on the K0326Y genome. (b) Relative gene expression of Pfpα for wild-type (CM105+), o2 (CM105o2 and W64Ao2), and QPM (CM105Mo2 and K0326Y). P-values are determined by two-tailed Student’s t-test. The error bars are defined as sample standard deviation from the sample size (biologically independent samples) of n = 5. c Distribution of Helitron insertions in QPM inbred lines, GWAS population and K0326Y X W64Ao2 F2 segregation population; x-axis shows the maize populations and the y-axis is the linked percentage. Source data underlying Figs. 4b, c are provided as a Source Data file.

