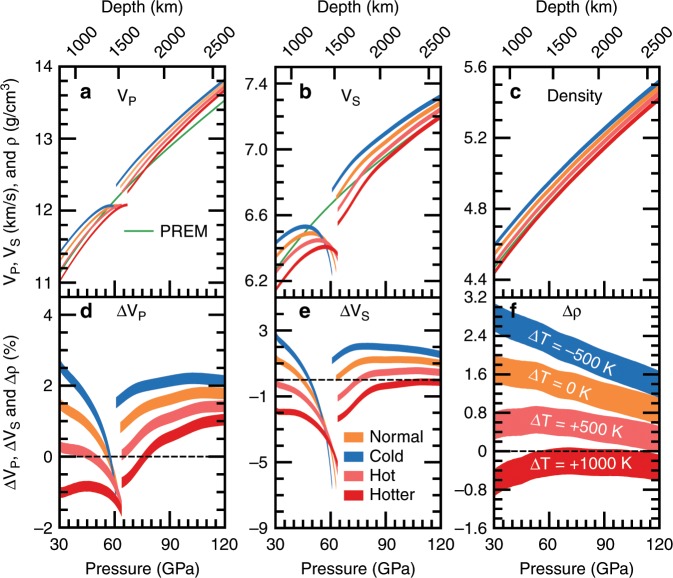
Fig. 4. Velocities and density characteristics of subducted oceanic crust.
a–c Wave velocities (VP and VS) and densities (ρ) of MORB along different mantle geotherms. The normal mantle geotherm is from Brown and Shankland (1981)47. Red, pink, orange, and blue lines represent VP, VS, and ρ of MORB along the mantle geotherms with variable temperature anomalies relative to the normal mantle geotherm. Temperature anomalies for red, pink, orange, and blue lines are + 1000 K, + 500 K, 0 K, and 500 K, respectively. Green lines are PREM values69. MORB32: 39% Fe- and Al-bearing bridgmanite (Mg0.58Fe0.16Al0.26Si0.74Al0.26O3), 30% Ca-perovskite (CaSiO3), 16% SiO2, and 15% Fe-bearing CF-type phase (Na0.4Mg0.48Fe0.12Al1.6Si0.4O4). (d) (e) (f) the VP, VS, and ρ contrasts between MORB and PREM. ∆M = 2(MMORB-MPREM)/(MMORB + MPREM), M = VP, VS, and ρ. MPREM, green lines in a, b, c; MMORB, red, orange, or blue lines in a, b, c. The linewidth represents uncertainties caused by the errors for elastic properties (<0.8%) and the variations in the concentration of dilute substitutional solutes (±1 mol%).

