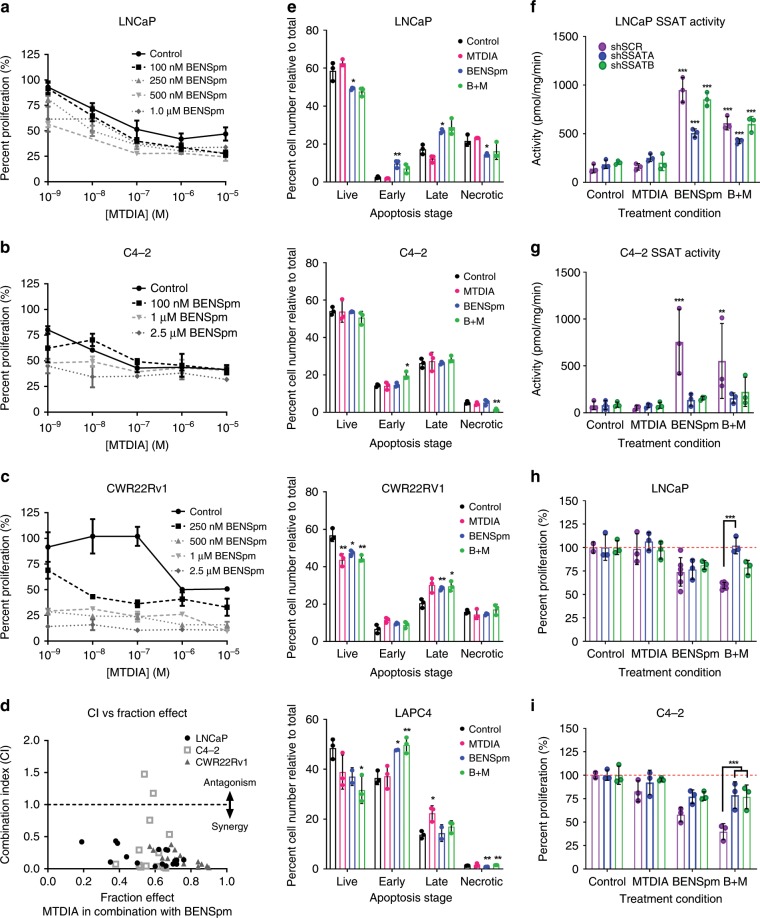
Fig. 2. BENSpm and MTDIA treatment is synergistic.
Cell proliferation curves for a 1 androgen sensitive cell line, LNCaP and 2 androgen independent lines, b C4-2 and c CWR22Rv1 treated with a vehicle control, 1 nM to 10 µM MTDIA, 100 nM to 2.5 µM BENSpm, or the combination of MTDIA and BENSpm at the indicated doses all in the presence of 20 µM MTA. Number of live cells were counted by trypan blue exclusion and reported relative to vehicle control, to give percent proliferation. For the remainder of the studies, cells were treated with vehicle control, 1 nM MTDIA, 1 µM BENSpm, or the combination (B + M) in 20 µM MTA for 8 days. d Combination Index values vs. the fraction effected for all doses shown in graphs 1a–c. Combination Index (CI) values calculated using the Chou-Talaly method and CompuSyn for LNCaP, C4-2, and CWR22Rv1 cells treated with BENSpm and MTDIA at indicated doses (CI < 1.0 = synergistic, CI > 1.0 = antagonistic, CI = 1.0 is additive). e Two androgen sensitive cell lines, LNCaP and LAPC-4 and two androgen independent cell lines, C4-2 and CWR22Rv1, were analyzed after 8 days of combination treatment (1 μM BENSpm and 1 nM MTDIA) by Flow Cytometry following staining with Annexin-V and Propidium iodide. The number of live cells, early apoptotic, late apoptotic, and necrotic cells are shown for all cell lines. SSAT enzyme activity assayed for LNCaP (f) and C4-2 (g) cells transfected with a scramble control (shSCR – black bars), or one of two shRNAs to SSAT (shSSAT A- blue bars or B- green bars). Indicated specific enzymatic activity is reported as pmol of radiolabeled acetyl-CoA produced per minute relative to protein concentration (pmol/minute/mg of protein). Percent cell proliferation (relative to vehicle control for each shRNA) for LNCaP (h) and C4-2 (i). Results for biological triplicates are shown (n = 3). Statistical analyses were performed using an unpaired Student t-test with Welch’s correction. All values are compared to vehicle control. Error bars for a–c represent standard error of the mean and for E-I represent standard deviation of the mean. *p < 0.05, **p < 0.01, ***p < 0.001.

