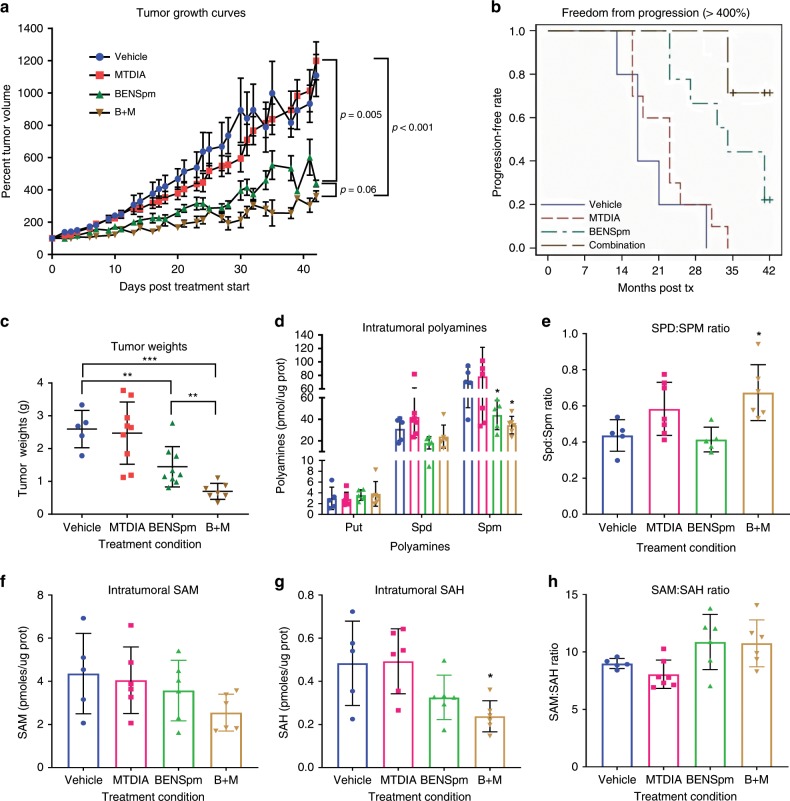
Fig. 5. BENSpm and MTDIA in combination provide the greatest efficacy in vivo.
Animals were subcutaneously implanted with 1 × 10⁶ CWR22Rv1 cells. Once tumors reached between 300 and 400 mm3 animals were placed on one of the four treatment cohorts, vehicle (blue), 50 mg/kg MTDIA (red), 100 mg/kg BENSpm (green) or the combination of 50 mg/kg MTDIA and 100 mg/kg BENSpm (brown). a Mean tumor sizes over time are plotted for each animal of the four treatment groups made relative to the starting tumor size at treatment day 0. The log relative tumor volume was modeled as a function of treatment, time, the time-treatment interaction, and random mouse effects and slopes using a linear mixed model. The growth rates were compared using tests about the appropriate linear contrasts of model estimates. (Vehicle; n = 5, MTDIA; n = 11, BENSpm; n = 9, Combo; n = 8). b The graph indicates progression free survival where progression is defined as reaching 400%. c The tumor weights at sacrifice for each group. (Vehicle; n = 5, MTDIA; n = 9, BENSpm; n = 9, Combo; n = 7). d Intratumoral polyamines (putrescine, spermidine, and spermine), e the spermidine-to-spermine ratio, f Intratumoral SAM levels, g Intratumoral SAH levels, and h the SAM:SAH ratio as measured by UPLC normalized to protein concentrations. (where for D-H Vehicle; n = 7, MTDIA; n = 9, BENSpm; n = 9, Combo; n = 7). Statistical analyses for graphs C-H were performed using an unpaired Student’s t-test with Welch’s correction. All values are compared to vehicle control unless otherwise indicated by connecting lines. Error bars represent standard deviation of the mean.*p < 0.05, **p < 0.01, ***p < 0.001.

