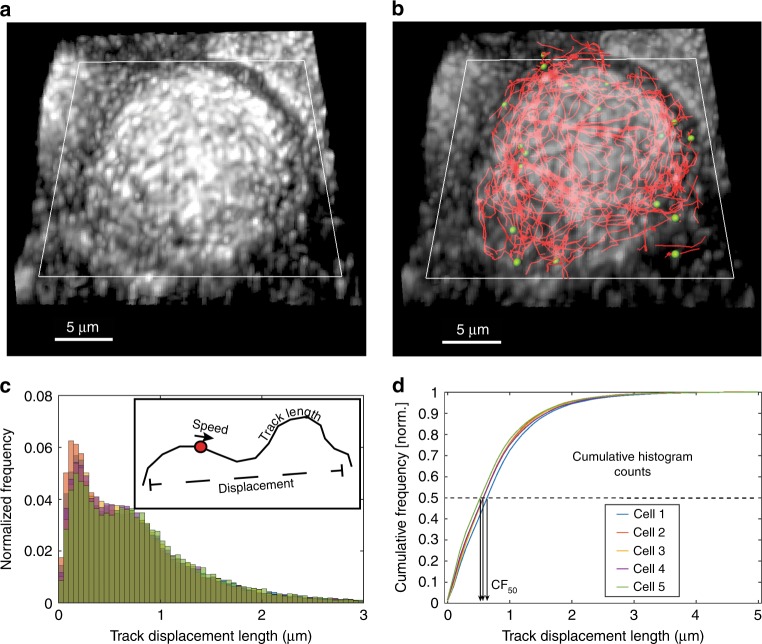
Fig. 1. Workflow to analyze intracellular motion in three dimensions (3D).
a Dual-view volumetric images are fused and deconvolved to obtain a single volumetric image with ~330-nm isotropic resolution23. Here, a diSPIM maximum intensity projection is shown for a WSN-infected A549 cell stably expressing GFP-tagged Rab11A (GFP-Rab11A). The coverslip plane (white rectangle) is also indicated. b Fluorescent puncta are identified and tracked over time in Imaris. For clarity, only tracks with displacement >2 μm are shown (red lines). Green spheres show GFP-Rab11A spot centers from a single time frame corresponding only to the shown tracks (for clarity, not all identified foci are shown here). c Distributions of motion parameters are binned into histograms, one histogram per cell parameter (e.g., track displacement histograms from five cells are shown here as a representative example). The inset illustrates parameters such as speed, track length, and displacement. All motion parameters are defined in the text. d Motion parameters (a representative example for track displacement is shown here) are compared across treatments by generating the corresponding cumulative histograms and measuring CF50—the x-axis value at which the cumulative frequency is 50%. This value summarizes the given motion parameter for that cell. One-way ANOVA with Tukey’s multiple tests is used to perform comparisons on CF50 values to gauge the effect of a treatment.

