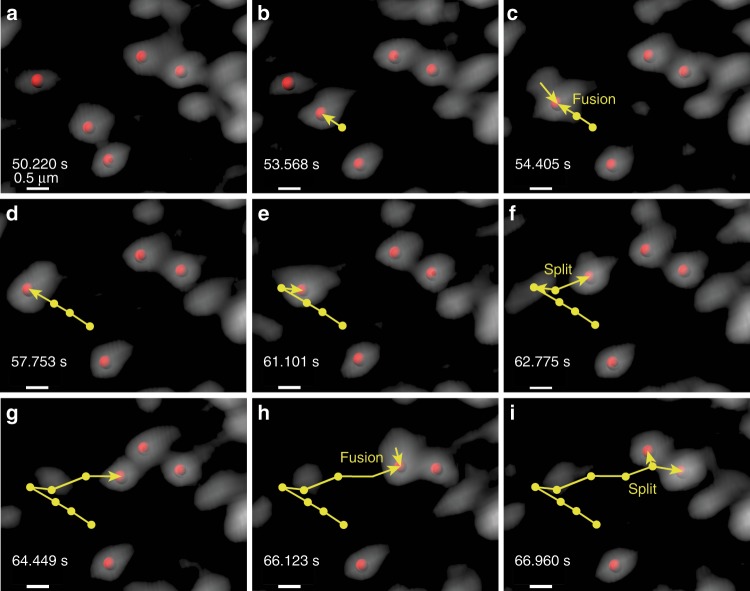
Fig. 2. Intracellular colocalization and splitting events for GFP-Rab11A foci.
Multiple instances of merging and splitting GFP-Rab11A foci (shown here in gray) can be identified in live-imaging datasets. a–i Chronologically ordered time snapshots follow a moving GFP-Rab11A spot merging with and splitting from other GFP-Rab11A foci. The yellow track shows location history and current direction of motion. For clarity, only centers of those GFP-Rab11A foci that take part in this interaction are denoted by red spots. The surrounding vesicles are either stalled or very slow moving. Timestamps show time elapsed since the start of the dataset. Scale bars are 0.5 μm as shown.

