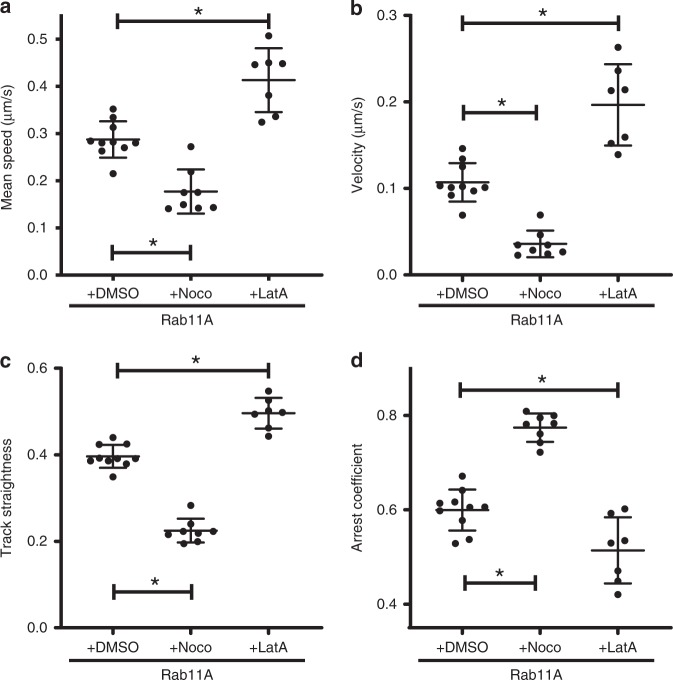
Fig. 3. Motion dynamics of Rab11A under the effect of cytoskeletal depolymerizing drugs.
A549 stable cells expressing GFP-Rab11A were treated with nocodazole (16 μM), latrunculin A (1 μM), or DMSO (control) and imaged 4 h post treatment. Imaging is performed at 37 °C on a temperature-controlled stage. Each datapoint represents an individual cell (DMSO: n = 10 cells, nocodazole: n = 8 cells, and latrunculin A: n = 7 cells) using CF50 for the corresponding motion parameters: a track mean speed, b track mean velocity, c track straightness, and d track arrest coefficient. Image processing and analysis were performed as described in the “Methods” section. Mean ± standard deviation (SD) is shown per group (* implies p < 0.05, comparisons performed using one-way ANOVA with Tukey’s multiple tests). Source data are provided as a Source Data file.

