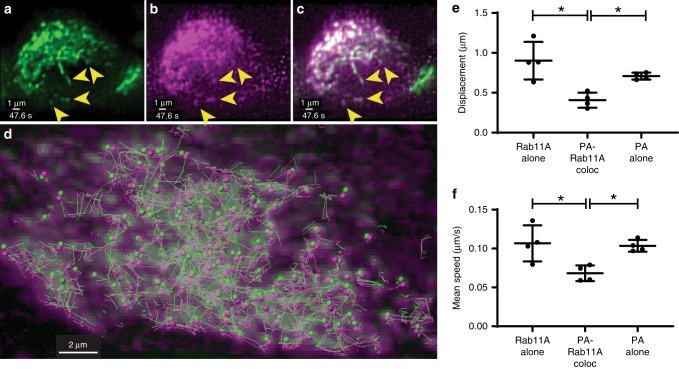
Fig. 6. Two-color imaging of PA::mRuby-infected GFP-Rab11A cells.
A549 cells stably expressing GFP-tagged Rab11A were infected with recombinant mRuby-tagged PA expressing IAV A/WSN/33. Cross-section through the volume depicting the signal from a GFP-Rab11A, b mRuby::PA, and c merged channels. Note the absence of GFP-Rab11A signal from the nuclear volume, whereas PA::mRuby comprises a homogeneous signal from within the nucleus. Yellow arrowheads point out the corresponding colocalizing puncta in the three channels corresponding to co-transporting species (see Supplementary Movie 11). d Overlap between maximum projection of GFP-Rab11A (green) and PA::mRuby (magenta) channels at a single timepoint (0 s) for the same dataset. Colocalizing puncta from each species at that timepoint are depicted by spheres of corresponding colors, while lines of corresponding colors depict their tracks over all times. Significant co-travel between colocalizing puncta is observed on account of close proximity between individual track segments traveling along the same direction. In the right panels, each datapoint represents an individual cell (n = 4 cells) using CF50 for the corresponding motion parameters: e track displacement and f, track mean speed for Rab11A singletons, Rab11A colocalized with PA::mRuby and PA::mRuby singletons. Mean ± SD are shown per group (* implies p < 0.05, comparisons performed using one-way ANOVA with Tukey’s multiple tests). Source data are provided as a Source Data file.

