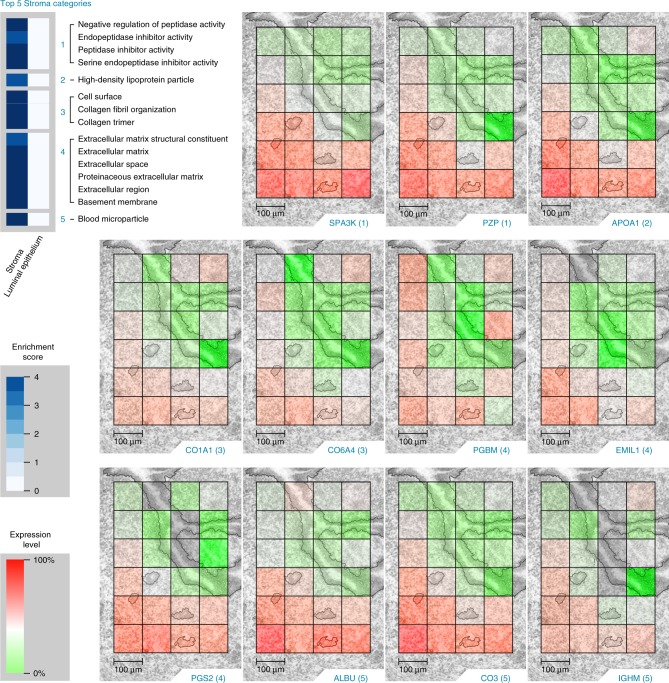
Fig. 5. The top 5 stroma (S) Gene Ontology categories (top, left) enriched in the statistically significant (Tukey-adjusted ANOVA or a Holm-adjusted g test, p value <0.05) proteins from the dominant cell population study and the corresponding protein images.
(1) Serine protease inhibitor A3K (SPA3K), pregnancy zone protein (PZP); (2) apolipoprotein A-I (APOA1); (3) collagen alpha-1(I) chain (CO1A1), collagen alpha-4(VI) chain (CO6A4); (4) basement membrane-specific heparan sulfate proteoglycan core protein (PGBM), EMILIN-1 (EMIL1), Decorin (PGS2); (5) serum albumin (ALBU), complement C3 (CO3), and immunoglobulin heavy constant mu (IGHM). Scale bars, 100 µm. The authors thank PNNL Graphic Designer Nathan Johnson for preparing the figure.

