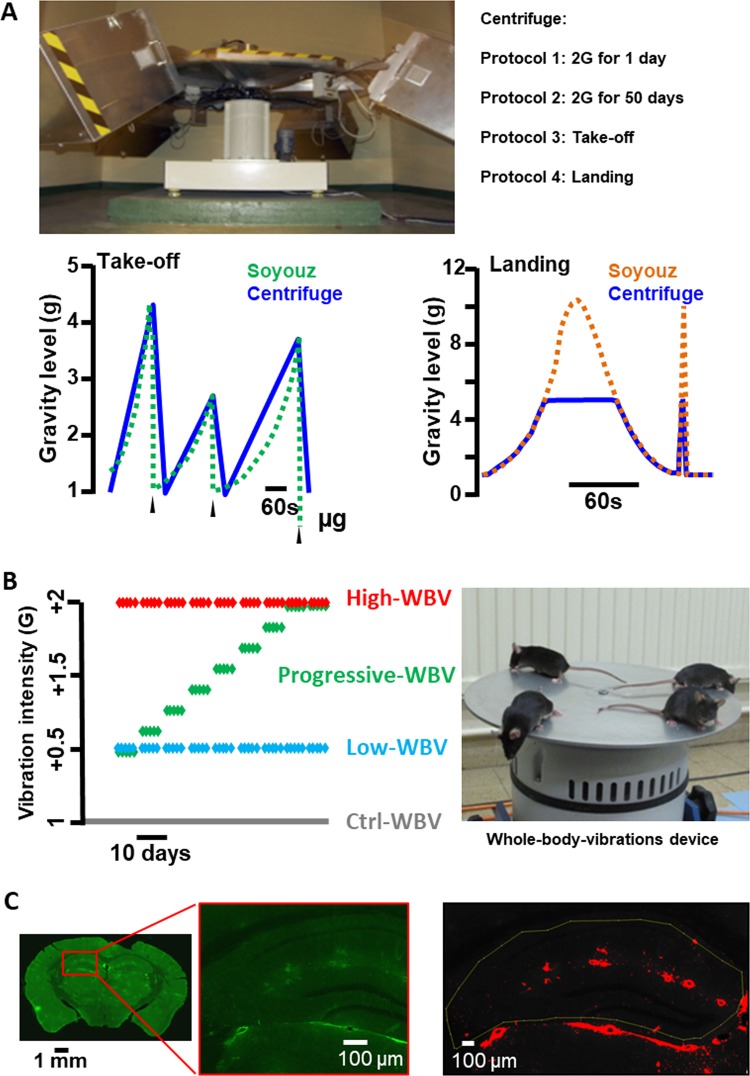
Fig. 3. Hypergravity and whole-body vibration protocols.
a Picture of the centrifuge. Bottom panels, profiles of gravity levels of the centrifuge reproducing those measured during landing and take-off of the Soyuz mission. b Vibration protocols of WBV (one dot = one day of vibration) and picture of mice on the device. c Example of the imaging process to interpret the immunostaining with, from left to right, typical imaging generated by Nanozoomer on one slide of brain (IgG coupled with FITC appears in green), the magnification of this image for fluorescence evaluation, and the image of a labelled area after application of the threshold on the analysed area (in red).

