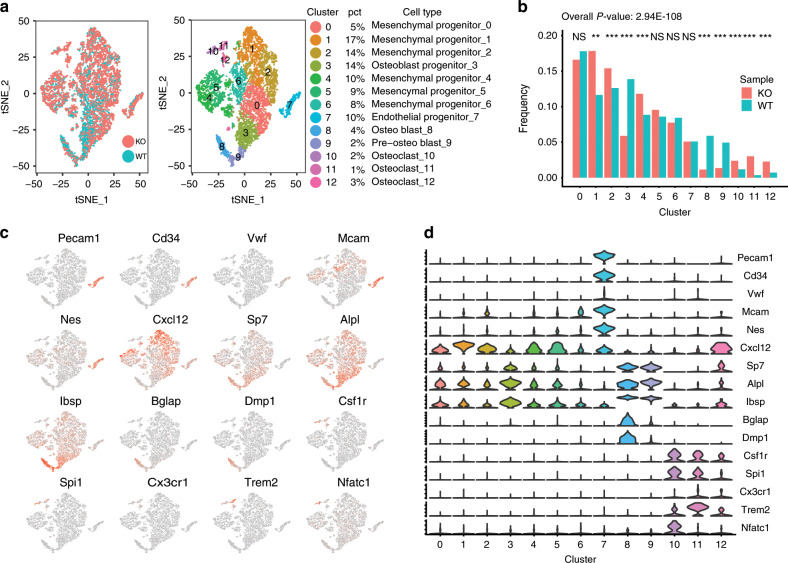
Fig. 3. Kindlin-2 loss reduces the osteoblast population but increases the osteoclast population.
a Single cell RNA sequencing data of the control and Kind2-D1 groups were merged, showing no marked batch effect (left). Cells were classified into 13 clusters (right). Four major cell types, including mesenchymal progenitors, endothelial progenitors, osteoblasts, and osteoclasts, were identified. The corresponding percentage of cells in each cluster is indicated. b The distribution of different cell types was significantly changed in the Kind2-D1 group (P value = 2.94E−108). Several clusters, including mesenchymal progenitors, osteoblasts, and osteoclasts, were significantly changed. P values were calculated with Pearson’s Chi-square test in R (version 3.5.2). c TSNEPlot of the merged data with selected marker genes. Red points indicate expression of the gene, and gray points indicate no expression. d Violin plot of the merged data with selected marker genes. The Y-axis indicates the expression level.

