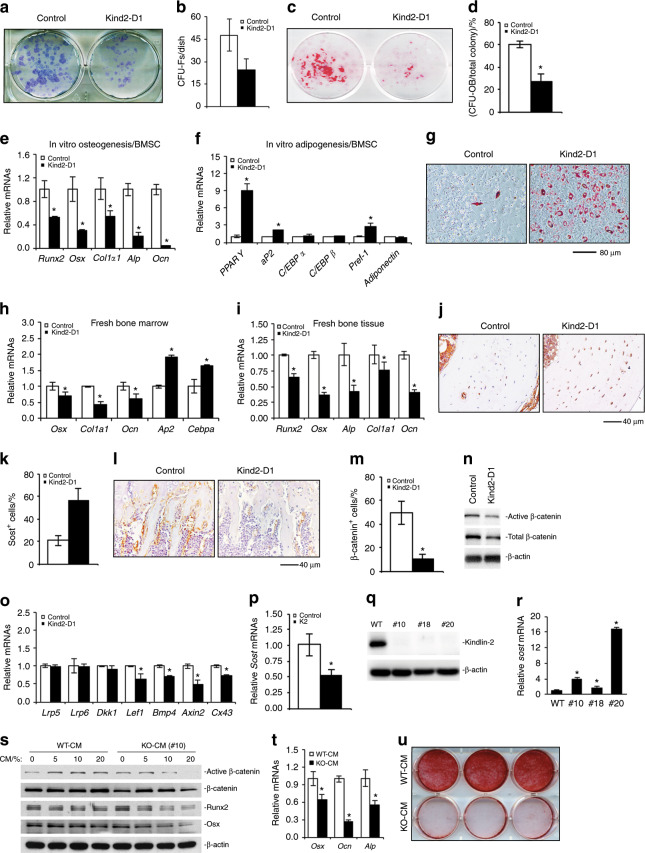
Fig. 5. Kindlin-2 loss impairs osteoblast formation and function.
a, b Colony forming unit-fibroblast (CFU-F) assays, followed by Giemsa staining (a). The number of CFU-F was counted under a microscope (b). *P < 0.05, versus controls, Student’s t-test. The results are expressed as the mean ± standard deviation (s.d.). N = 3 mice per group. (c, d) Colony forming unit-osteoblast (CFU-OB) assays. *P < 0.05, versus controls, Student’s t-test. The results are expressed as the mean ± standard deviation (s.d.). e–g In vitro osteoblastic or adipogenic differentiation of primary bone marrow stromal cells (BMSCs), followed by Oil Red O staining (g). *P < 0.05, versus controls, Student’s t-test. The results are expressed as the mean ± s.d. Scale bar, 80 mm. h Real-time RT-PCR (qPCR) analyses. *P < 0.05, versus controls, Student’s t-test. N = 4 mice per genotype. The results are expressed as the mean ± s.d. i Real-time RT-PCR (qPCR) analyses. *P < 0.05, versus controls, Student’s t-test. N = 4 mice per genotype. The results are expressed as the mean ± s.d. j, k Immunohistochemical (IHC) staining of tibial diaphyseal cross-sections of 2-month-old male Kind2-D1 and their control littermates with an antibody against sclerostin. Scale bar, 40 mm. N = 8 control mice; N = 7 Kind2-D1 mice. *P < 0.05, versus controls, Student’s t-test. The results are expressed as the mean ± s.d. l, m Immunohistochemical (IHC) staining of tibial metaphyseal longitudinal sections of 2-month-old male Kind2-D1 and control littermates with an antibody against active b-catenin. Scale bar, 40 mm. N = 8 control mice; N = 7 Kind2-D1 mice. *P < 0.05, versus controls, Student’s t-test. The results are expressed as the mean ± s.d. n Western blot analysis. o Real-time RT-PCR (qPCR) analyses. N = 3 control mice; N = 4 Kind2-D1 mice. *P < 0.05, versus controls, Student’s t-test. The results are expressed as the mean ± s.d. p qPCR analysis. *P < 0.05, versus controls, Student’s t-test. The results are expressed as the mean ± s.d. q Crispr/Cas-9 deletion of Kindlin-2 in MLO-Y4 osteocyte-like cells. r qPCR analysis. *P < 0.05, versus controls, Student’s t-test. The results are expressed as the mean ± s.d. (s–u) MC-4 preosteoblastic cells were cultured in osteoblast differentiation media in the presence of the conditioned media from parent MLO-Y4 cells (WT-CM) or Kindlin-2-deficient subclone #10 (KO-CM) for 5 d, followed by western blotting with the indicated antibodies (s) or qPCR analysis of the indicated genes normalized to Gapdh mRNA (t), or 10 d, followed by Alizarin red staining (u).

