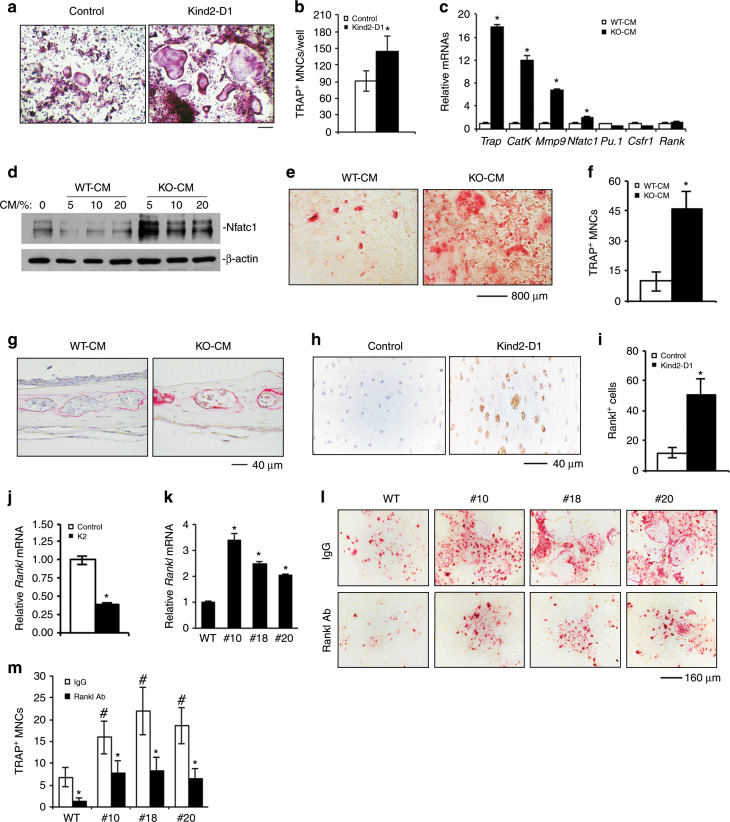
Fig. 7. Kindlin-2 loss promotes RANKL expression in osteocytes and promotes osteoclast formation in vitro and in bone.
a, b Tartrate-resistant acid phosphatase (TRAP) staining. Nonadherent bone marrow monocytes (BMMs) from 3-month-old female Kind2-D1 mice and their control littermates were induced with the macrophage colony-stimulating factor (M-CSF) (10 ng·mL−1) and RANKL (50 ng·mL−1) for 7 d, followed by TRAP staining (a). TRAP-positive multiple nucleated cells (MNCs) with ≥3 nuclei per well were scored (b). *P < 0.05, versus controls, Student’s t-test. The results are expressed as the mean ± s.d. Scale bar, 160 mm. c–f Osteoclast gene expression and TRAP staining. Primary BMMs from 2-month-old wild-type male C57BL/6 mice were treated with WT-CM and KO-CM (from subclone #10) in the absence of exogenous RANKL for 7 d, followed by qPCR analysis, which were normalized to Gapdh mRNA (c); 2 d followed by western blotting for Nfatc1 (d); or 7 d followed by TRAP staining (e). TRAP-positive MNCs (≥3 nuclei) per well were scored (f). g Calvariae were dissected from 4-week-old wild-type C57BL/6 mice and cultured with 15% FBS a-MEM media in the presence of 20% WT-CM and KO-CM (#10) in the absence of exogenous RANKL for 3 d. N = 4 mice per group. Scale bar, 40 mm. h, i Immunohistochemical (IHC) staining of diaphyseal cross-sections of tibiae of 6-month-old male Kind2-D1 mice and their control littermates with an antibody against RANKL. Scale bar, 40 mm. N = 6 control mice; N = 8 Kind2-D1 mice. *P < 0.05, versus controls, Student’s t-test. The results are expressed as the mean ± s.d. j Real-time RT-PCR (qPCR) analysis. *P < 0.05, versus controls, Student’s t-test. The results are expressed as the mean ± s.d. (k) Real-time RT-PCR (qPCR) analysis.*P < 0.05, versus controls, Student’s t-test. The results are expressed as the mean ± s.d. (l, m) MLO-Y4/BMM coculture. Parent MLO-Y4 cells or Kindlin-2-deficient subclones (#10, #18, and #20) were cocultured with primary BMMs from 2-month-old wild-type C57BL/6 mice in the presence of 10 nmol·L−1 1,25-dihydroxyvitamin D3 and in the presence of 40 ng normal goat IgG (top) or 40 ng goat anti-mouse RANKL-neutralizing antibody (bottom) for 8 d, followed by TRAP staining (l). Note: no RANKL was added to the cultures. TRAP-positive multiple nucleated cells (MNC) with ≥3 nuclei per well were scored (m). #P < 0.05, versus WT, *P < 0.05, versus IgG, Student’s t-test. The results are expressed as the mean ± s.d. Scale bar, 160 mm. Experiments were performed with six samples per group and independently repeated two times; qualitatively identical results were obtained.

