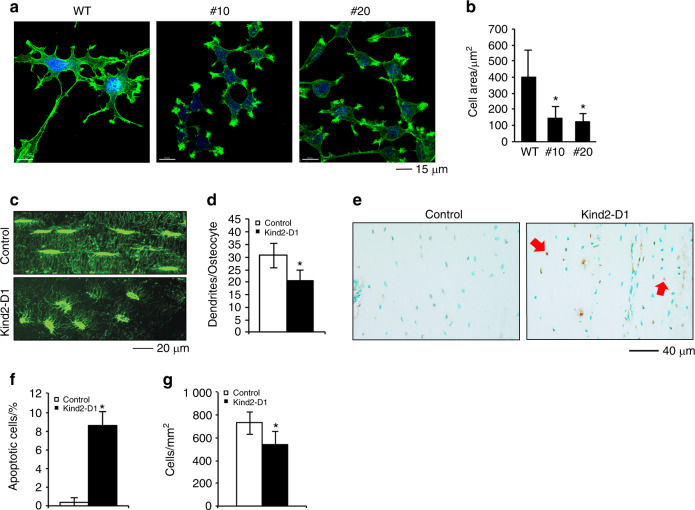
Fig. 8. Kindlin-2 loss impairs osteocyte spreading and dendrite formation and increases cell apoptosis.
a, b Confocal image analysis of MLO-Y4 osteocyte-like cells. Parent MLO-Y4 and Kindlin-2-deficient subclones (#10 and #20) were cultured in 8-well chambers (Thermo Fisher Scientific, Rochester, NY, USA, cat#: 154534) in a-MEM media for 24 h, followed by staining with 0.5% (v/v) Phalloidin-488 (Invitrogen, cat#, A12379). Scale bar, 15 mm. Measurements of cell area (b). *P < 0.05, versus wild-type (WT), Student’s t-test. The results are expressed as the mean ± standard deviation (s.d.). c, d Immunofluorescence (IF) staining. Undecalcified tibial sections of the two genotypes were stained with an anti-F-actin antibody. Scale bar, 20 mm. The numbers of osteocyte dendrites were quantified (d). N = 13 osteocytes from 6 control mice, N = 17 osteocytes from 6 Kind2-D1 mice. *P< 0.05, versus control, Student’s t-test. The results are expressed as the mean ± standard deviation (s.d.). e, f Terminal deoxynucleotidyl transferase dUTP nick end labeling (TUNEL) staining. Tibial sections of 3-month-old female Kind2-D1 mice and their control littermates were subjected to TUNEL staining (e). Quantification of apoptotic cells in the cortical bone matrix (f). Red arrows indicate apoptotic osteocytes imbedded in the bone matrix. N = 6 mice per group. *P < 0.05, versus controls, Student’s t-test. The results are expressed as the mean ± s.d. g Osteocyte density in cortical bones. *P < 0.05, versus WT, Student’s t-test. The results are expressed as the mean ± s.d. N = 9 mice for control, N = 10 mice for Kind2-D1.

