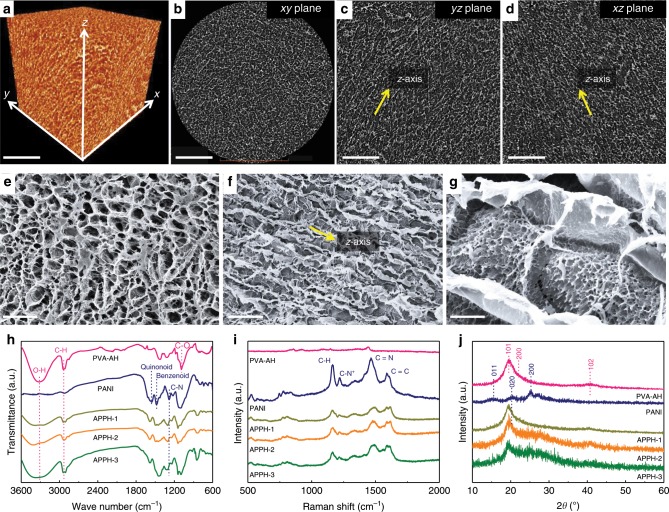
Fig. 2. Structural and compositional characterization.
a Volume rendering of the anisotropic polyvinyl alcohol/polyaniline hydrogel-2 (APPH-2) derived from X-ray computed microtomography (microCT) images, and microCT images display b xy, c yz, and d xz plane, respectively. Scale bars: a–d 100 μm, respectively. Scanning electron microscopy (SEM) images of the APPH-2 from view of e perpendicular and f, g parallel to z-axis. Scale bars: e, f 20 μm, respectively; g 2 μm. Yellow arrow in f indicating the z-axis. h Fourier transform infrared spectra (FTIR), i Raman spectra and j X-ray diffraction (XRD) patterns of the PANI, PVA anisotropic hydrogel (PVA-AH), and APPH.

