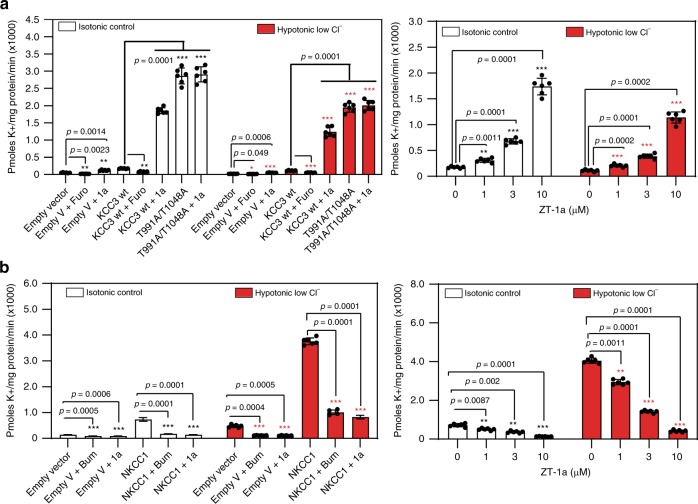
Fig. 3. ZT-1a inhibition of SPAK kinase correlates with CCC activity.
a 86Rb+ uptake assays in the presence of ZT-1a measure transport activity of KCC3A. (a—left panel) HEK-293 cells were transfected with constructs encoding the indicated WT or mutant constructs of N-terminally FLAG-tagged KCC3. Thirty-six hours post transfection, cells were exposed for 30 min to either control isotonic conditions or hypotonic low [Cl−] conditions (to activate the SPAK/OSR1 pathway), and then treated in the same conditions for an additional 30 min with 10 µM ZT-1a or 1 mM furosemide (Furo) in the presence of 1 mM ouabain (Na+/K+-ATPase inhibitor) and 0.1 mM bumetanide (NKCC1 inhibitor). 86Rb+ uptake was allowed to proceed for 10 min and was then quantified by scintillation counting. 86Rb+ uptake counts per minute (CPM)s were normalized per mg protein and plotted for both isotonic and hypotonic conditions. (a—right panel) HEK-293 cells were transfected with constructs encoding wild-type N-terminally FLAG epitope-tagged KCC3A. Thirty-six hours post transfection, cells were exposed for 30 min to either control isotonic conditions or hypotonic low [Cl−] conditions (to activate the SPAK/OSR1 pathway), and then treated for an additional 30 min in the same conditions with the indicated ZT-1a concentrations in the presence of 1 mM ouabain and 0.1 mM bumetanide. Ten-minute 86Rb+ uptake values were quantified by scintillation counting, normalized per mg protein for each condition, and plotted for both isotonic and hypotonic conditions. ***p < 0.001; **p < 0.01; *p < 0.05; ns—nonsignificant [by one-way ANOVA with post hoc testing (n = 6, error bars represent the mean ± SEM)]. b 86Rb+ uptake assays in the presence of ZT-1a measure transport activity of NKCC1. (b—left panel) HEK-293 cells were transfected with WT NKCC1 cDNA construct. Thirty-six hours post transfection, cells were exposed for 30 min to either control isotonic conditions or hypotonic low [Cl−] conditions (to activate the SPAK/OSR1 pathway), and then treated in the same conditions for an additional 30 min with 10 µM ZT-1a or 0.1 mM bumetanide (Bum) in the presence of 1 mM ouabain (Na+/K+-ATPase inhibitor). 86Rb+ uptake was allowed to proceed for 10 min and was then quantified by scintillation counting. 86Rb+ uptake CPMs were normalized per mg protein and plotted for both isotonic and hypotonic conditions. (b—right panel) HEK-293 cells were transfected with WT NKCC1 cDNA construct. Thirty-six hours post transfection, cells were exposed for 30 min to either control isotonic conditions or hypotonic low [Cl−] conditions (to activate the SPAK/OSR1 pathway), and then treated for an additional 30 min in the same conditions with the indicated ZT-1a concentrations in the presence of 1 mM ouabain. Ten-minute 86Rb+ uptake values were quantified by scintillation counting, normalized per mg protein for each condition, and plotted for both isotonic and hypotonic conditions. ***p < 0.001; **p < 0.01; *p < 0.05; ns—nonsignificant [by one-way ANOVA with post hoc testing (n = 6, error bars represent the mean ± SEM)].

