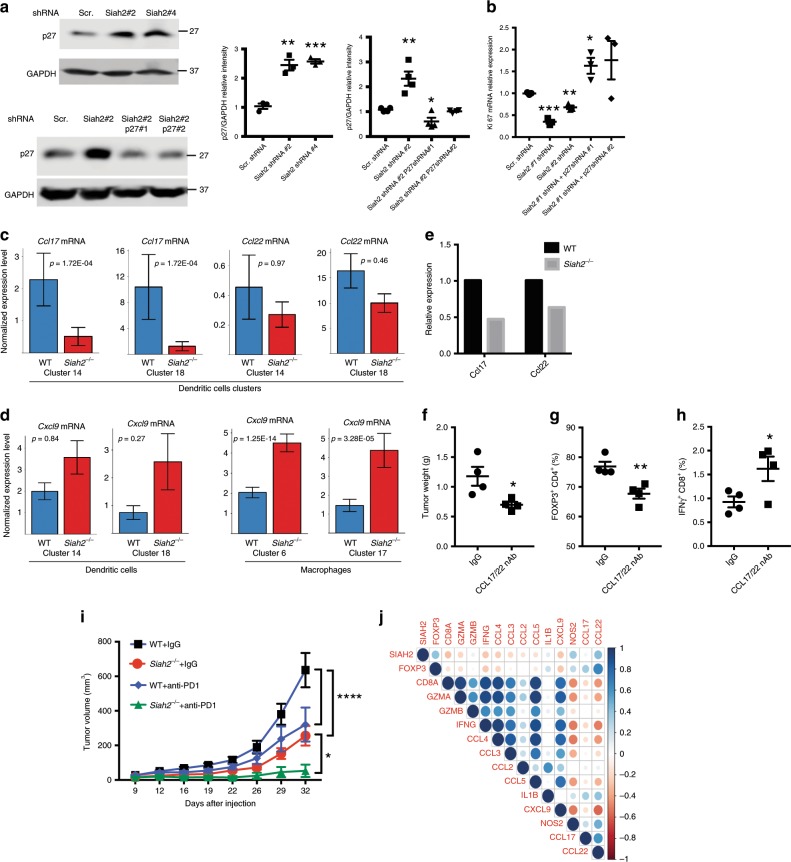
Fig. 6.
Siah2−/− effect on cell proliferation is p27-dependent a, b Jurkat cells were depleted of Siah2 alone or of Siah2 and p27 via infection with lentivirus harboring indicated shRNAs. Proteins prepared were analyzed by immunoblot for p27 and GAPDH as loading control (n = 4; relative intensity of p27 shown in the graphs) a, while RNA prepared was processed for qPCR analysis of Ki67 transcripts b. c Ccl17 and Ccl22 mRNA expression, as identified by single-cell RNAseq within dendritic cell clusters (C14 and C18) in both genotypes. d Cxcl9 mRNA expression, as identified by single-cell RNAseq within dendritic cell clusters (C14 and C18) in both genotypes. e Ccl17 and Ccl22 mRNA expression of CD11c+-sorted cells from tumors from both genotypes. Ten tumors were collected per sample 11 days after YUMMER1.7 cell inoculation. Data are representative of two independent experiments. f–h Weight of tumors collected 19 days after YUMMER1.7 cell inoculation of WT mice, which were injected i.p. with CCL17 and CCL22 neutralizing antibodies every other day, starting 3 days after melanoma cell inoculation (n = 4) f. At the end of the treatment described in f (day 19), tumors were collected and frequencies of tumor-infiltrating Foxp3+ cells within the CD4+ T cell population g and of IFN-γ- expressing CD8+ cells (n = 4) were determined h. i Loss of Siah2 synergizes with PD1 therapy. Mean growth curves over time of tumors derived from YUMM1.7 cells (150,000) injected into WT and Siah2−/− mice, which were then treated with anti-PD-1 antibody (200 μg/mouse; three times per week for a total of five times) or rat isotype (IgG) starting at day 7 after melanoma cell injection. WT and Siah2−/− IgG (n = 8); WT and Siah2−/− anti-PD-1 antibodies (n = 7). Shown are complete regression (CR) rates at study termination. j Positive correlation between Siah2 and Foxp3 expression in immunogenic melanoma tumors. Spearman’s rank correlation plots (scatterplots) for pairwise comparisons between SIAH2 expression (mRNA z-scores) and the Genset identified in Treg immune signature seen in Siah2−/− mice expressed in the metastatic samples with high immune signals from TCGA_SKCM (n = 66)48; mean ± s.e.m. Data were analyzed by Wilcoxon rank-sum test c, d, unpaired t-test a, b, f–h or two-way ANOVA with Bonferroni multiple comparison i. ***P < 0.0005, **P < 0.005, and *P < 0.05.

