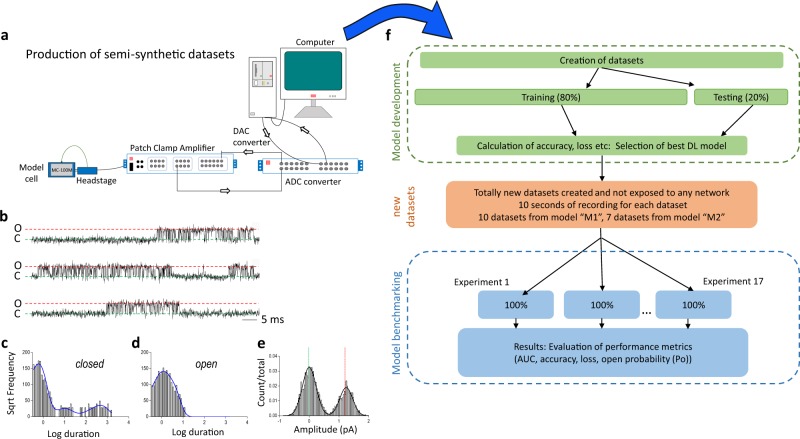
Fig. 1. Workflow diagram: generation of artificial analogue datasets.
a For training, validation and benchmarking, data were generated first as fiducial records with authentic kinetic models in MATLAB (Fig. 2); these data were then played out through a CED digital to analogue converter to a patch clamp amplifier that sent this signal to a model cell and recorded the signal back (simultaneously) to a hard disk with CED Signal software via a CED analogue to digital converter. The degree of noise could be altered simply by moving the patch-clamp headstage closer to or further from the PC. In some cases, drift was added as an additional challenge via a separate Matlab script. Raw single channel patch clamp data produced by these methods are visually indistinguishable from genuine patch clamp data. To illustrate this point, we show here a standard analysis work-up for one such experiment with b raw data, then it’s analyses with QuB: kinetic analyses of c channel open and d closed dwell times. Finally, we show (e) all points amplitude histogram. The difference between this and standard ion channel data is that here we have a perfect fiducial record with each experimental dataset, which is impossible to acquire without simulation. f Illustrates our over-all model design and testing workflow. The Supplementary Information includes training metrics from the initial validation and the main text here shows performance metrics acquired from 17 experiments with entirely new datasets. The training datasets typically contained millions of sample points and the 17 benchmarking experiments were sequences of 100,000 samples each.

