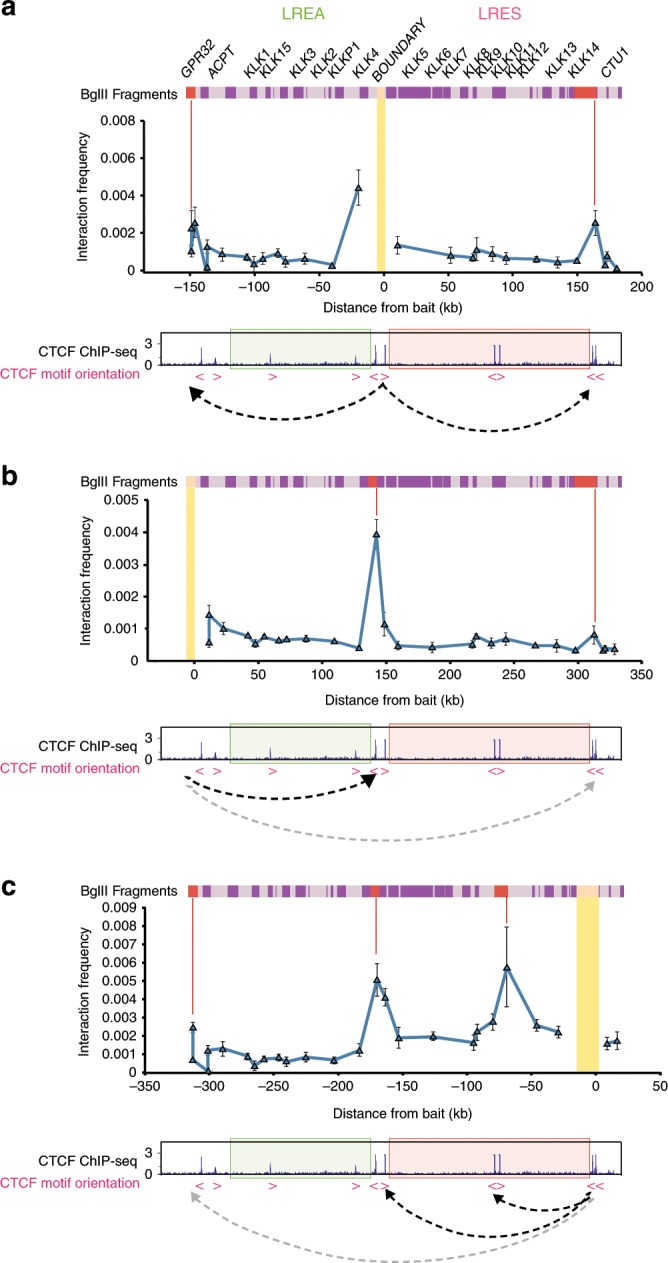
Fig. 2. 3D structure of the KLK locus compartmentalises expression domains.

a 3C-qPCR at the KLK locus. Bars above the graph illustrate BglII fragments across the region. The 3C bait fragment is indicated by the yellow bar and interacting fragments are shown by red lines (149.2 kb upstream from bait, 163.8 kb downstream from bait). The pink arrows indicate the direction of CTCF motifs. The dotted arrows demonstrate the loops indicated by the interaction data. Error bars represent standard error (SE). b As in a, utilising upstream interacting fragment from a as bait. Interacting fragments are 143.2 and 313.0 kb downstream from the bait. c As in a, utilising downstream interacting fragment from a as bait. Interacting fragments are 68.9, 169.8 and 313.0 kb upstream from the bait.
