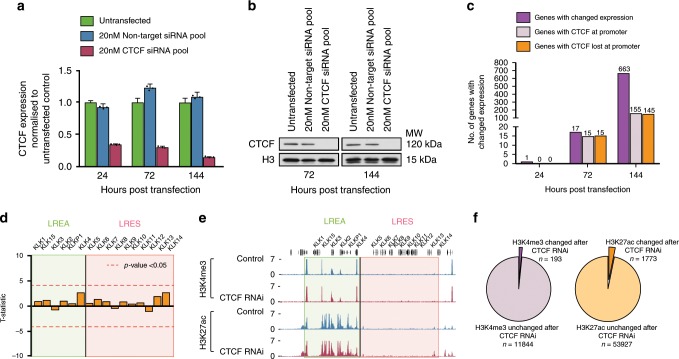
Fig. 3. CTCF RNAi leads to modest changes to gene expression and chromatin.
a qPCR measuring relative levels of CTCF mRNA for untransfected, control siRNA and CTCF siRNA conditions at 24, 72 and 144 h following transfection of LNCaP cells with 20 nM control and CTCF siRNA. Error bars represent SE. Data for technical replicates n = 3 are overlaid as a dot blot. b Western blots for CTCF following 72 and 144 h of CTCF RNAi show >90% reduction of CTCF protein. Source data are provided as a Source Data file. c Bar graph shows total number of genes with changed expression following 24, 72 and 144 h of CTCF RNAi (dark purple). Light purple bars indicate the number of total genes with changed expression that have CTCF binding at their promoter. Orange bars show the number of this subset that loses CTCF binding following CTCF RNAi. d T-statistics show no significant difference (p-value < 0.05, indicated by dashed line) in KLK locus gene expression between control and CTCF RNAi samples (144 h post transfection) processed on an Affymetrix Gene Chip 2.0 expression array. n = 2 biologically independent experiments. e ChIP-seq for H3K4me3 and H3K27ac following 144 h of CTCF RNAi revealed no change to binding strength at KLK region. f Venn diagrams displaying proportion of H3K4me3 and H3K27ac modifications that undergo significant change in binding strength following 144 h of CTCF RNAi.

