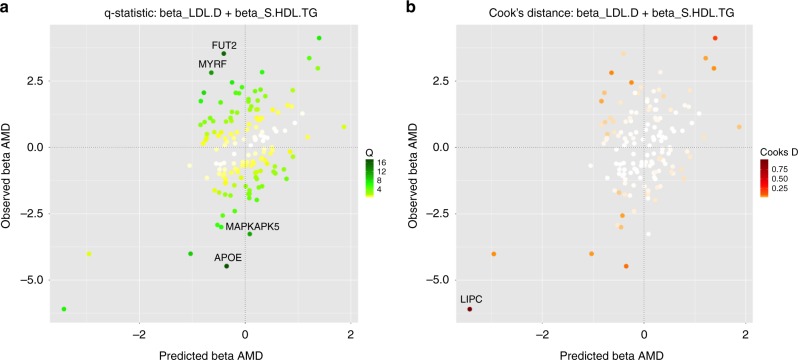
Fig. 4. Diagnostic plots for outliers and influential genetic variants.
Plotting the predicted associations with AMD based on the model including LDL.D, and S.HDL.TG (-axis) against the observed associations with AMD (-axis) showing all genetic variants. This is the highest-ranking model when keeping outlying and influential genetic variants in the analysis. The colour code shows: a the -statistic for outliers and b Cook's distance for the influential points. Any genetic variant with -value larger than 10 or Cook's distance larger than the median of the relevant -distribution is marked by a label indicating the gene region.

