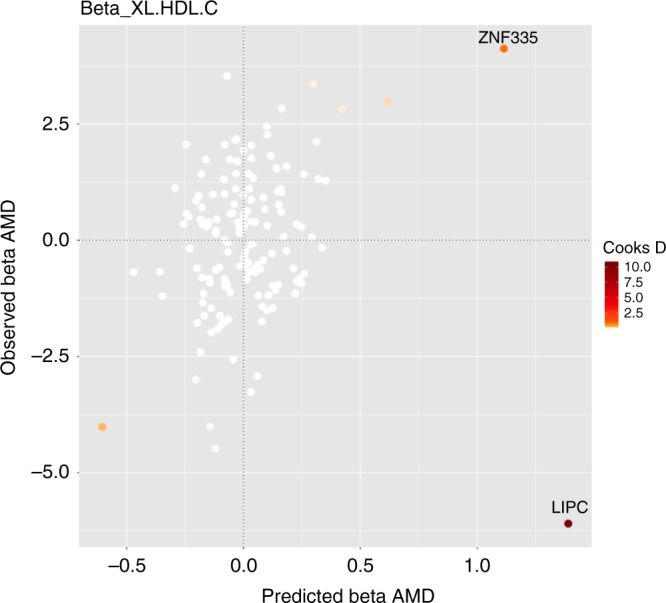
Fig. 5. Diagnostic plot for influential genetic variants.

Plotting the predicted associations with AMD based on the model including XL.HDL.C (-axis) against the observed associations with AMD (-axis) showing all genetic variants, where the colour code shows Cook's distance for the genetic variants. This is the highest-ranking model on omission of outlying and influential genetic variants from the analysis. Note rs26134 in the LIPC gene region which has an anomalous direction of association with AMD risk in contrast to all other genetic variants.
