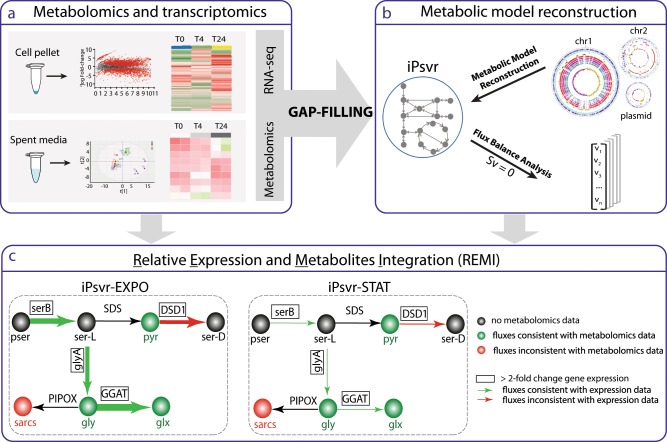
Fig. 1. Schematic overview of the integrated genomic-transcriptomic-metabolomic pipeline applied in this study.
a Stage 1: Relative gene expression and exometabolomic data were determined and analyzed, and these data were used to gap-fill iPsvr at blocked reactions. b Stage 2: A genome-scale metabolic model (GEM) of P. veronii strain 1YdBTEX2, iPsvr, was reconstructed and flux-balance analysis (FBA) was performed to simulate the growth of the cell. c Stage 3: Additional relative differential gene expression and metabolite abundance data were integrated into the metabolic model with REMI and physiology-specific models were built. Here, the REMI methodology is illustrated on a section of inferred iPsvr glycine, serine and threonine metabolism and iPsvr-EXPO (exponential phase) and iPsvr-STAT (stationary phase) as the two physiology-specific models. Significantly differentially expressed genes (here, serB, glyA, DSD1 and GGAT) are outlined in boxes. The thickness of arrows designates the fold-change in estimated fluxes, where green arrows indicate consistency with the gene-expression fold-change values, and the red ones inconsistencies. Measured metabolite concentrations (here: pyr, sarcs, gly and glx) are indicated in green if the values are consistent with estimated fluxes and in red otherwise. Phosphoserine phosphatase, SerB; Serine hydroxymethyltransferase, GlyA; D-serine dehydratase, DSD1; Glyoxylate aminotransferase, GGAT; Pyruvate, pyr; Sarcosine, sarcs; Glycine, gly; Glyoxylate, glx.

