
Fig. 4. Differential in silico production (mmol/gDW/h) of seven biomass building block groups between the exponential and stationary growth phase.
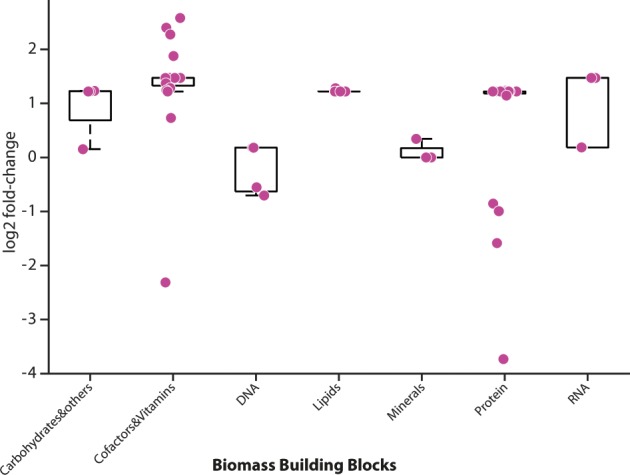
The result of the integration of relative gene expression and metabolite abundance data (EXPO vs STAT) using REMI-TGexM. Each dot in the graph represents the individual biomass precursors within that category and all the dots represenet statistically significant changes (p = value < 0.05). For BBB group statistics, see Table S8.