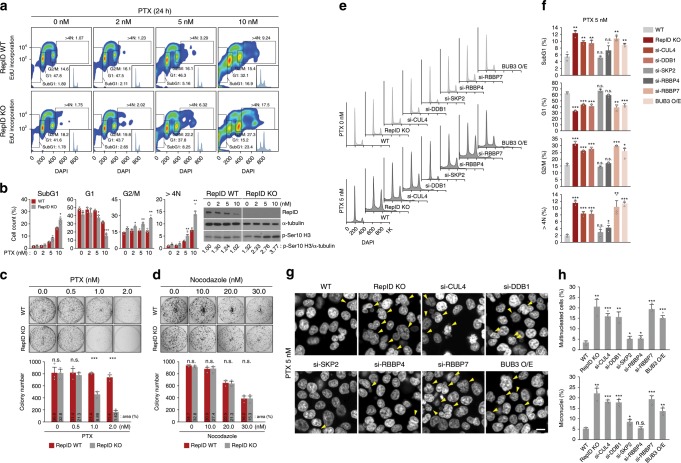
Fig. 5. RepID-deficient cells are more sensitive to paclitaxel.
a Paclitaxel (PTX) treatment increases the prevalence of subG1, G2/M, and >4N populations in RepID-deficient HCT116 cells. HCT116 RepID WT and KO cells treated with PTX for 24 h were labeled with EdU for 30 min prior to collection and analyzed by FACS. Percentage of each cell cycle phase was indicated in EdU-positive histogram plots (insets). b Bar graph depicting the cell cycle distribution of cells collected in a from three biologically independent experiments (left panel). Immunoblot analysis showing elevated accumulation of phosphorylated histone H3 in RepID-deficient cells in response to PTX treatment as in a (right panel). c Colony-formation assay with HCT116 RepID WT and KO cells upon PTX treatment. Bar charts indicate colony number, and the percentage of covered area is provided above the bars. d Nocodazole sensitivity is not changed by RepID deficiency. e–h Failure of RepID-CRL4RBBP7-based BUB3 degradation leads to increased sensitivity to PTX treatment. e Depleted/overexpressed HCT116 cells as indicated were treated with PTX and analyzed by FACS. Histogram indicates asynchronized (upper panel) or PTX-treated cells (bottom panel). f Percentage of cells in subG1, G1, G2/M, and >4N phase in e. g Nuclear staining after PTX treatment in depleted/overexpressed HCT116 cells as indicated. Red arrows indicate multinucleated cells. Scale bar: 10 μm. h Percentage of multinucleated cells and micronuclei in g. Error bars in all results represent standard deviation from three independent experiments (*p value < 0.05, **p < 0.01, ***p < 0.001, n.s. not significant, Student’s t test).

