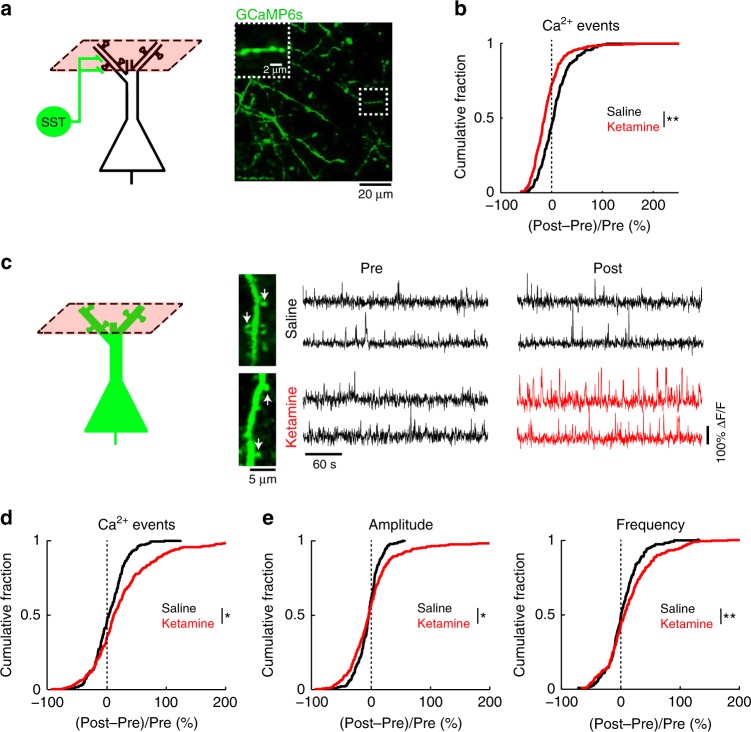
Fig. 2. Ketamine induces opposing effects on dendrite-targeting SST axons and apical dendrites of pyramidal neurons.
a Schematic of imaging location, and an in vivo two-photon image of GCaMP6s-expressing SST axons in superficial layers of Cg1/M2 of SST-IRES-Cre animals. Inset, magnified view of a SST axonal segment. b The normalized difference in the rate of spontaneous calcium events for SST axons in superficial layers. Normalized difference was calculated as post-injection minus pre-injection values normalized by the pre-injection value (ketamine (10 mg/kg): −9 ± 3%, saline: 12 ± 7%, mean ± s.e.m.; P = 0.002, two-sample t-test). For ketamine, n = 269 boutons from 5 animals. For saline, n = 214 boutons from 5 animals. c Left, schematic of imaging location. Right, each row shows time-lapse fluorescence transients from the same dendritic spine in the pre-injection (left) and post-injection (right) periods. Two example spines were plotted for saline injection (black) and two other examples were plotted for ketamine (10 mg/kg) injection (pre-injection: black; post-injection: red). Locations of the spines in the in vivo two-photon images are indicated by white arrows. d Same as (b) but for dendritic spines in superficial layers of Cg1/M2 (ketamine (10 mg/kg): 43.42 ± 0.01%, saline: 4.34 ± 0.01%, mean ± s.e.m.; P = 0.02, two-sample t-test). For ketamine, n = 280 dendritic spines from 5 animals. For saline, n = 231 dendritic spines from 5 animals. e The normalized difference in amplitude (ketamine (10 mg/kg): 5 ± 4%, saline: −4 ± 1%, mean ± s.e.m.; P = 0.03, two-sample t-test), and frequency of binned calcium events (ketamine (10 mg/kg): 16 ± 4%; saline: 4 ± 2%; P = 0.008, two-sample t-test). *P < 0.05; **P < 0.01; ***P < 0.001; n.s., not significant.

