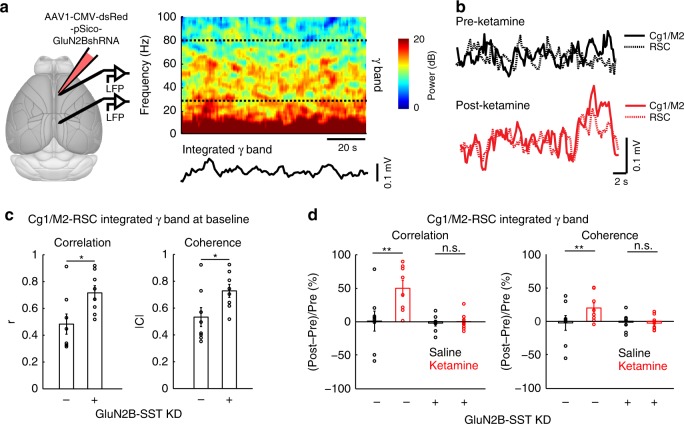
Fig. 8. Elevated prefrontal cortical functional connectivity depends on dendritic inhibition.
a Left, schematic of experimental setup. Right, spectrogram of an example local field potential (LFP) recording in Cg1/M2 of a SST-IRES-Cre animal. Dashed lines indicate the upper and lower bounds of the frequency range used to calculate the integrated gamma band signal, which is plotted below the spectrogram. b Integrated gamma band signals from LFPs recorded simultaneously from Cg1/M2 (solid line) and RSC (dashed line) of a SST-IRES-Cre animal. Example signals were plotted before (black) and after (red) ketamine (10 mg/kg) injection. c Network-scale effects of prefrontal cortical SST interneuron manipulations (SST-IRES-Cre animals with or without GluN2B-SST KD). Functional connectivity between Cg1/M2 and RSC was quantified by determining the correlation and coherence between integrated gamma band signals of the two brain regions. At baseline prior to injection, control and GluN2B-SST KD animals had significantly different correlation coefficients (controls: 0.48 ± 0.08, GluN2B-SST KD: 0.72 ± 0.05, mean ± s.e.m.; P = 0.03, Wilcoxon rank sum test) and coherence magnitude (controls: 0.53 ± 0.07, GluN2B-SST KD: 0.73 ± 0.05, mean ± s.e.m.; P = 0.04, Wilcoxon rank sum test). n = 8 animals each for controls and GluN2B-SST KD. d Functional connectivity between Cg1/M2 and RSC after ketamine (10 mg/kg) or saline for SST-IRES-Cre animals with or without GluN2B-SST KD. For correlation, a two-way mixed ANOVA was performed with treatment (GluN2B-SST KD, no KD) as the between factor, and drug (saline, ketamine) as the within factor. The interaction effect was significant (F(1,14) = 6.2, P = 0.03). Post-hoc Tukey-Kramer test showed a significant ketamine-saline difference in the no KD group (P = 0.003), but not in the GluN2B-SST KD group (P = 0.9). For coherence, the interaction effect was significant (F(1,14) = 7.1, P = 0.02). Post-hoc Tukey-Kramer test showed a significant ketamine-saline difference in the no KD group (P = 0.003), but not in the GluN2B-SST KD group (P = 0.8). n = 8 animals each for controls and GluN2B-SST KD. *P < 0.05; **P < 0.01; ***P < 0.001; n.s., not significant.

