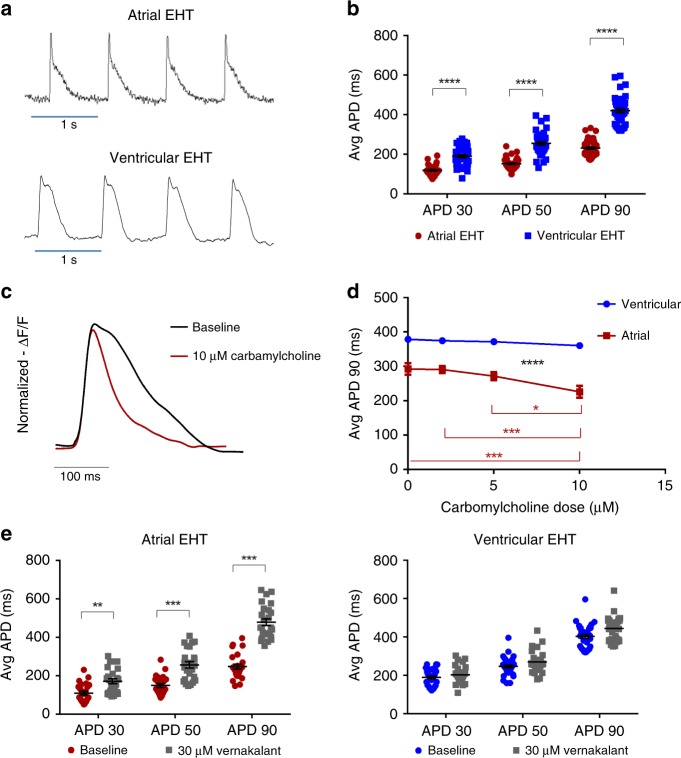
Fig. 3. Electrophysiological characterization of the chamber-specific EHTs.
a Confocal line-scan images showing examples of optical AP recordings of atrial and ventricular cells within the chamber-specific EHTs. b Comparison of mean APD30, APD50, and APD90 values in the atrial and ventricular EHTs (n = 46 and n = 42 cells, respectively, from three independent experiments) during 1 Hz field stimulation. ****p < 0.0001, unpaired t test. c, d Changes in AP morphology (c) and duration (APD90) (d) following application of increasing doses (0, 2, 5, 10 µM) of carbamylcholine and 1.5 Hz field stimulation in the chamber-specific EHTs. Note that significant AP shortening was observed in the atrial (*p < 0.05, ***p < 0.001), but not in the ventricular EHTs (p = NS, repeated-measurements two-way ANOVA followed by Sidak post hoc analysis, n = 19 cells from three independent experiments for both the atrial and ventricular experiments). e Changes in mean APD30, APD50, and APD90 values following application of 30 µM verankalant during 1.5 Hz field stimulation. The atrial cells (n = 25 cells from three independent experiments) showed significant prolongations while the effect on the ventricular cells (n = 32 cells from three independent experiments) was not statistically significant. All values are expressed as mean ± SEM. **p < 0.01, ***p < 0.001, unpaired t test.

