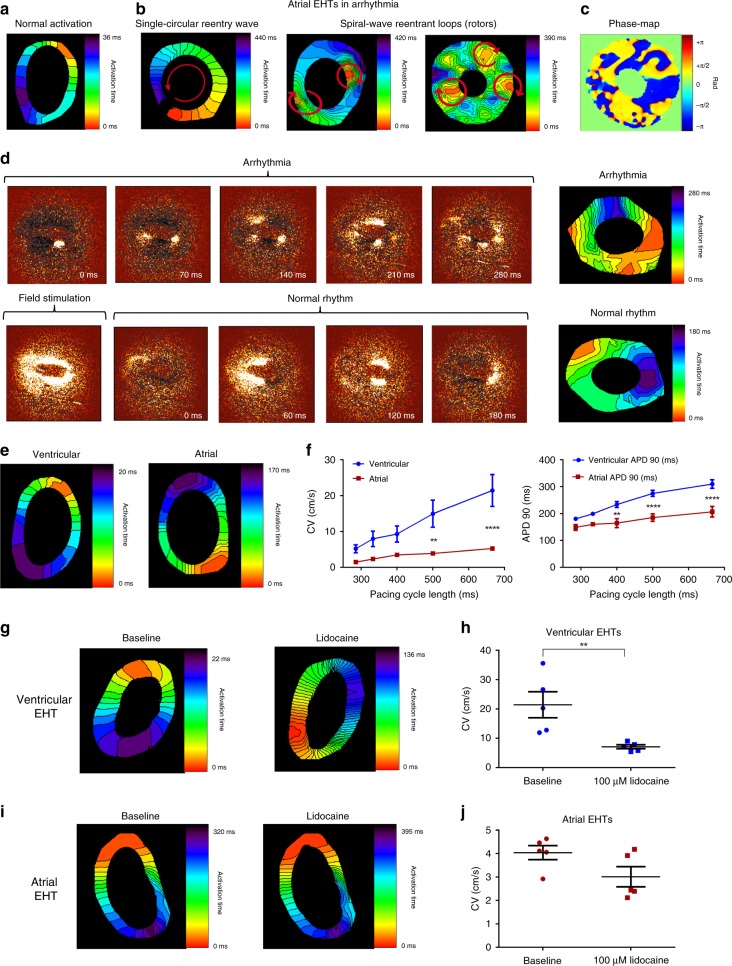
Fig. 4. Optical mapping of the chamber-specific EHTs.
a Activation map of a ventricular EHT during spontaneous activation showing the propagation of the electrical wavefront throughout the EHT from the earliest (red) to latest (purple) activation sites. b Activation maps of atrial engineered tissue during spontaneously-occurring different re-entrant arrhythmias including: a single anatomical macro-reentrant loop (left panel) and multiple spiral waves (middle and right panels). c A snap shot of a phase map characterizing the rotors in the atrial EHT. Colors represent phase as indicated in the color bar. d Time-lapse sequences (left panels) and the resulting activation maps (right panels) of wavefront propagation in an atrial EHT during an arrhythmia, during application of field stimulation, and following the renewal of normal activity. e Activation maps of ventricular and atrial EHTs during point stimulation at a frequency of 1.5 Hz. f Changes in conduction velocity (CV) values (left panel, n = 5, biologically independent samples) and APD90 (right panel, n = 6, biologically independent samples) in the atrial and ventricular EHTs as function of the pacing cycle length (**p < 0.01, ****p < 0.0001, repeated-measurements two-way ANOVA followed by Sidak post hoc analysis). g–j Effects of addition of 100 µM lidocaine on the resulting activation maps (g, i) and mean CV values (h, j) of ventricular (g, h) and atrial (i, j) EHTs (n = 5 biologically independent samples). Recordings were performed at a stimulation frequency of 1.5 Hz. Values are expressed as mean ± SEM. **p < 0.01, Mann–Whitney test.

