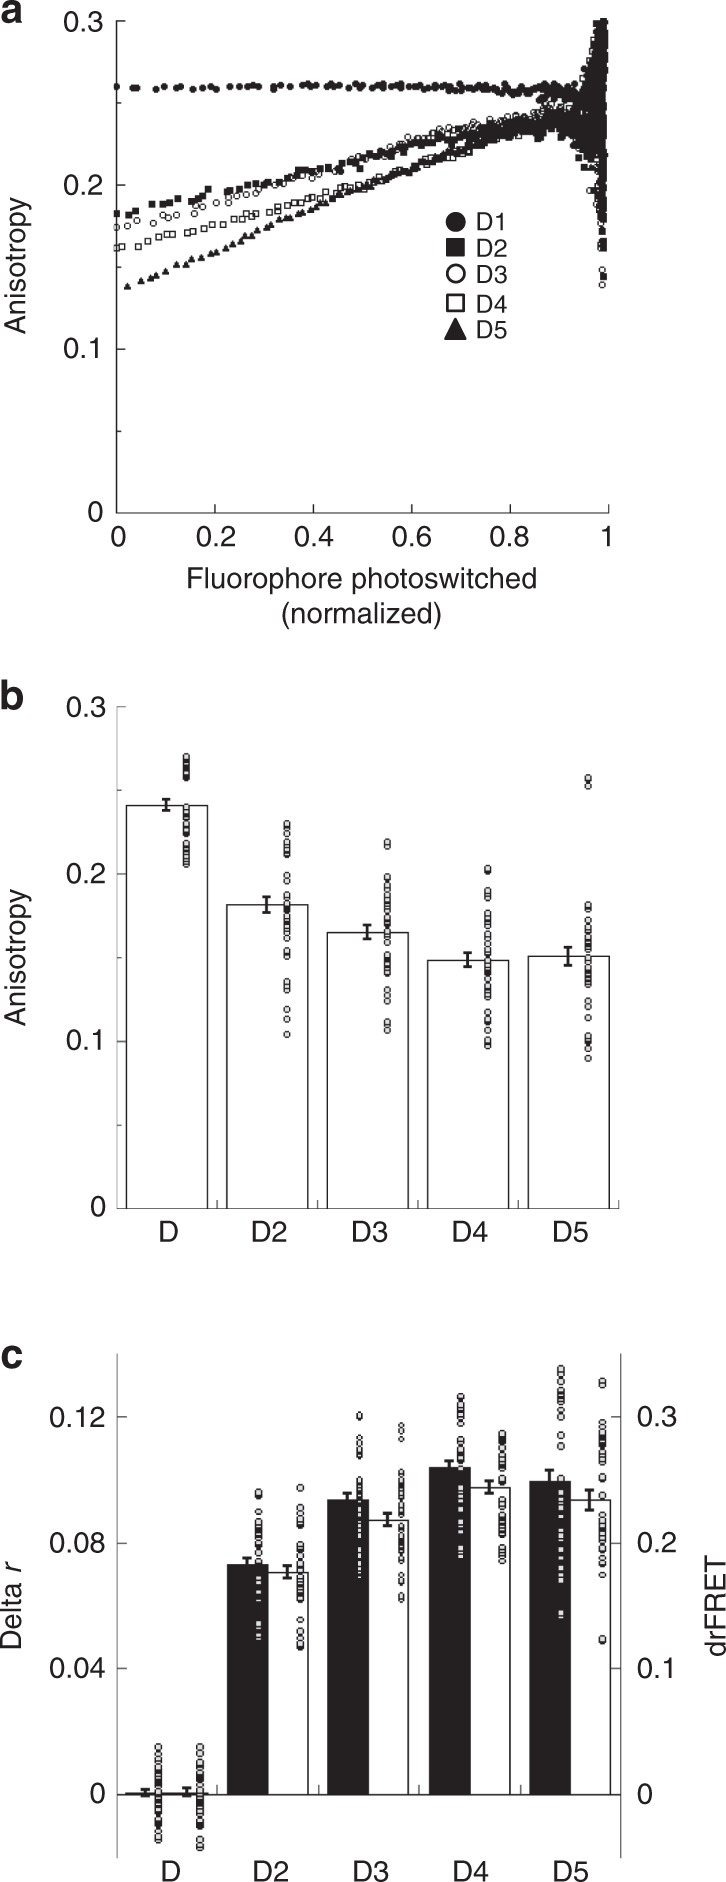
Fig. 3. psAFRET measurements of Dronpa fluorescent protein oligomers.

a COS-7 cells expressing Dronpa (black circles), D2 (black squares), D3 (white circles), D4 (white squares), or D5 (black triangles) were imaged and photoswitched. The anisotropy was determined and displayed as a function of the fluorophore photoswitched. b The conventional steady-state anisotropy for each chimera was determined from the first data points of the photoswitching experiment. ANOVA indicated significant differences for all comparisons except D3-D5 and D4-D5 (p-value < 0.05). Cohen’s d values ranged 0.54–3.12. Data represent mean ± sem (n = 45). c The data points representing ~80% of the fluorescence were fitted to linear equations for experiments performed and analyzed as shown in (a). These were used to determine the anisotropy before and after photoswitching. The difference in anisotropy (delta r, black columns) is shown compared with its conversion to drFRET efficiency (white columns) using Eq. (2). ANOVA indicated significant delta r differences for all comparisons except D3-D5 and D4-D5 (p-value < 0.05). Cohen’s d values ranged 0.62–6.44. ANOVA indicated significant drFRET differences for all comparisons except D3-D5 and D4-D5 (p-value < 0.05). Cohen’s d values ranged 0.7–6.74. Data represent mean ± sem (n = 45). Circles overlaid on columns in the bar graphs represent individual data points. Source data are provided as a Source Data file.
