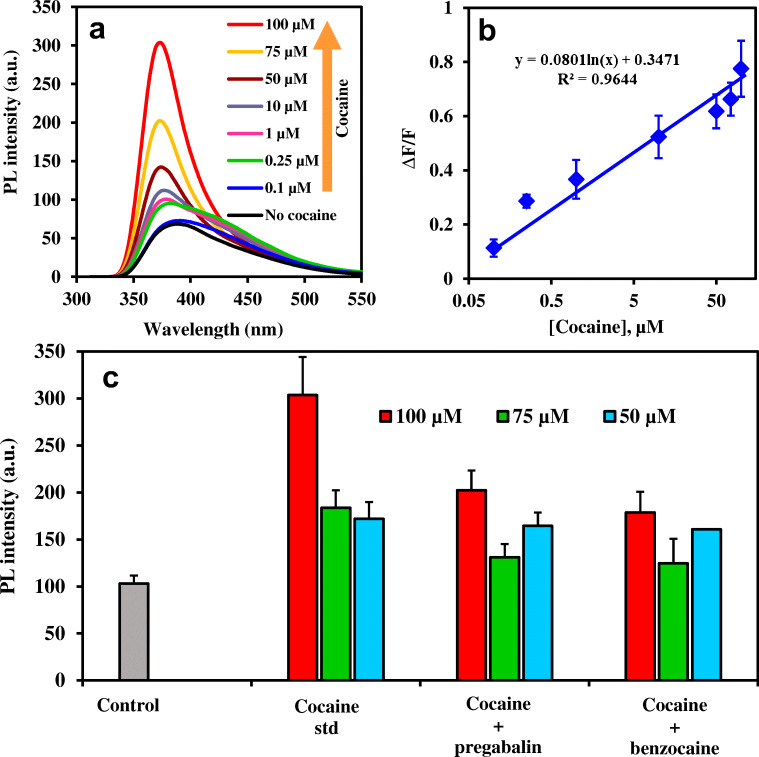
Fig. 6.
a Fluorescence “turn ON” spectra of the strep-B-QDs-GO-CTAB-AuNP aptamer nanoprobe to cocaine quantitative determination, b Photoluminescence (PL) intensity calibration plot for cocaine quantitative determination, c PL intensity signal for the determination of 100, 75 and 50 μM pure cocaine standard in comparison to adulterated cocaine samples containing benzocaine and pregabalin. Error bars are standard deviation of 3 replicate analysis. Λexc = 290 nm. Maximum PL intensity signal taken at ~370 nm

